There are two ways to understand what CorTexT Manager is. The first one is to look at what has been achieved in terms of methods, tools and therefore lines of code. The second one is studied below, by analyzing (here with CorTexT Manager) what academic users have published using… CorTexT Manager.
Our study of the productions which mentioned the use of CorText Manager!
To analyse the scientific production that mentioned the use of CorTexT Manager, we have collected from different bibliographical search engines (Scopus, WOS…), from google and google scholar and from websites of some conferences (STI, EASST, EUSPRI), all documents (publications, reports, conference proceedings, books…) containing the terms “CorText Manager”, “CorText.net”, “CorTexT platform” and “Plateforme Cortext”. We then carried out various analyses, also using CorTexT Manager, by working on the authors, and on the terms and the places extracted from the titles and the abstracts of the documents. Through these analyses, we seek to understand how the scientific production that used CorTexT Manager has evolved and to characterise it (Who used CorTexT Manager? On which subjects do the productions focus? What are the fields of study of the productions? What sources of data did the authors work on and what methods did they mention?).
Over the period 2012 to 2021, we considered 223 documents that were written by 531 authors (workshops were not taken into account in this analysis). This represents just under 10% of the total number of users. Academic production has increased over the years (follow this page to see the documents considered and to appreciate the evolution of the production over the years): the last two years (2020 and 2021) gather 40% of the number of documents of the whole period.
Who is publishing with CorTexT Manager? *
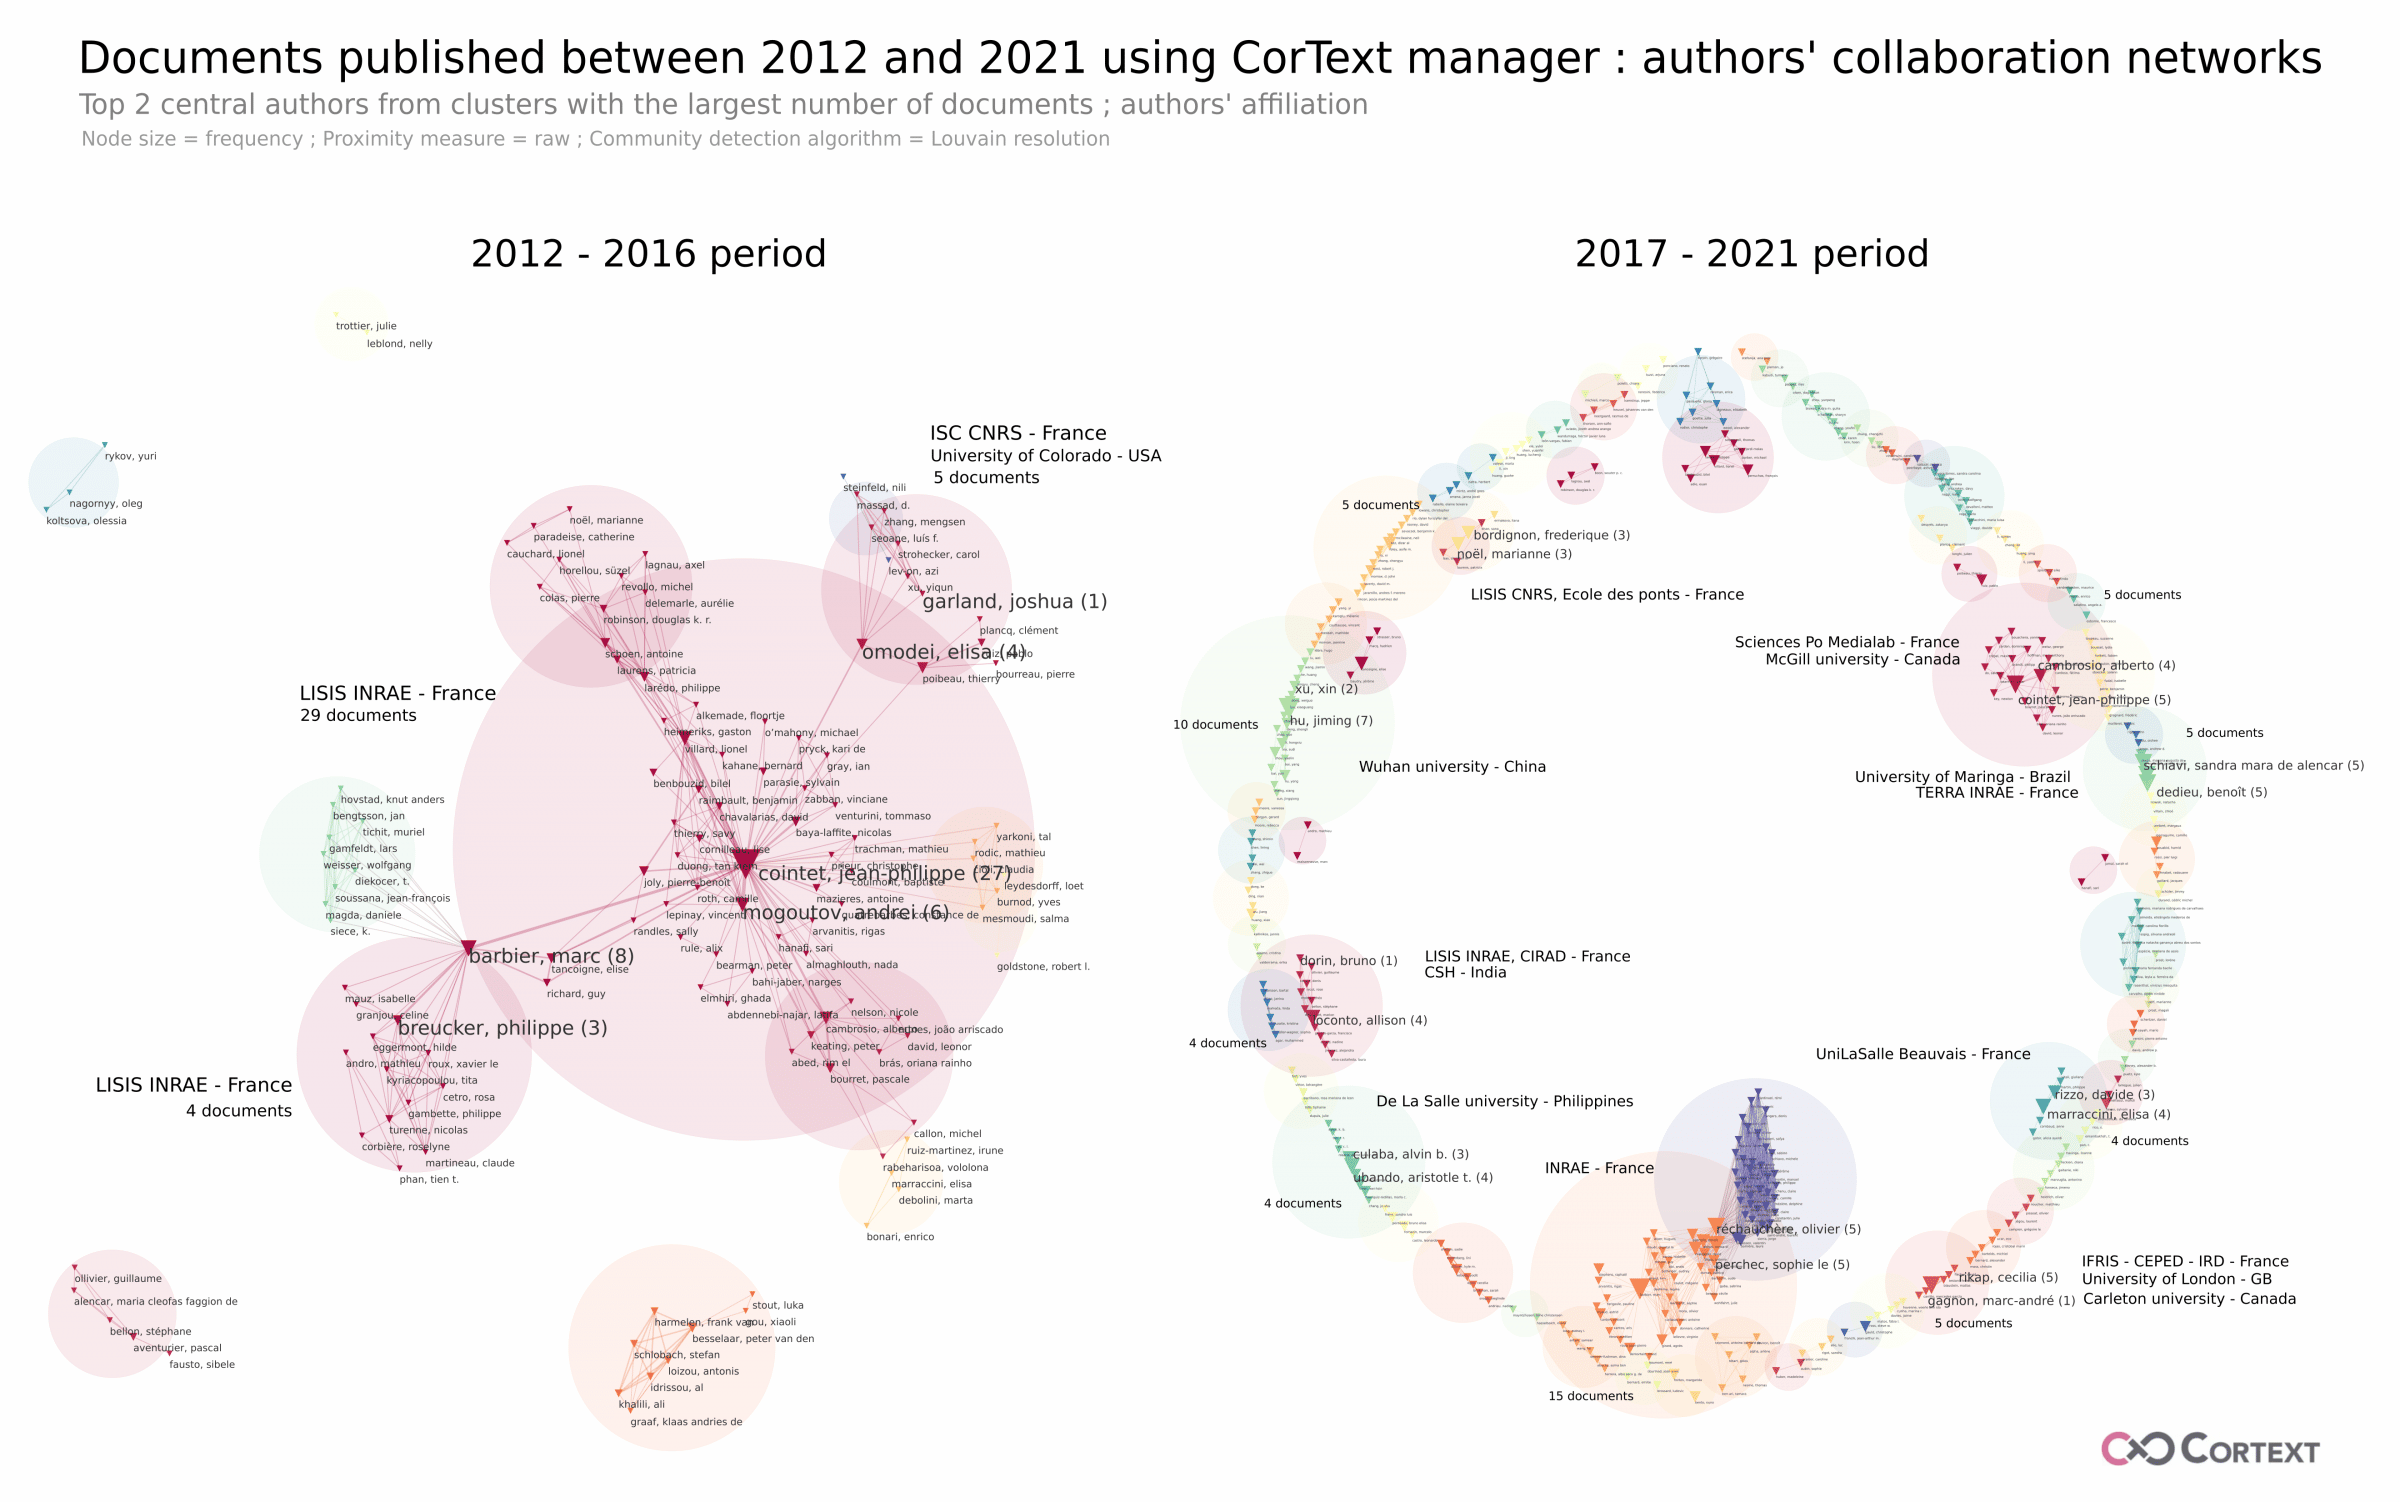
Parameters used for this network mapping (click on the parameter to have more information)
Proximity measure = raw; Node size = frequency; Community detection algorithm = Louvain resolution
These two figures represent the authors’ collaboration networks before and after 2017. These maps highlight an important change in the structure of the collaboration network in recent years. Before 2017, as shown by the connected clusters, the production came mainly from collaboration networks of some members of the LISIS, the laboratory that now holds CorTexT Platform. In this main connected component, one of the founders of the CorTexT platform play a central role and was very prolific: Jean-Philippe Cointet.
After 2017, the structure of the collaboration network changed significantly: the map shows a majority of clusters grouping together few documents, independent of each other. Thus, the map does not highlight large networks of authors who collaborate with several on a regular basis, but rather a set of authors who use the platform occasionally working on one or more documents for the period covered. However, there are some clusters of authors associated with at least four documents. Among these, we still find members of LISIS, but we also observe the emergence of user communities in many other research environments and in other countries than France: for example, De La Salle University in Philippines, Wuhan University in China, State University of Maringá in Brazil, UniLaSalle Beauvais, other INRAE entities in France…
On which subjects do the productions which use CorTexT Manager focus? What are the places and the fields of study mentioned in the documents?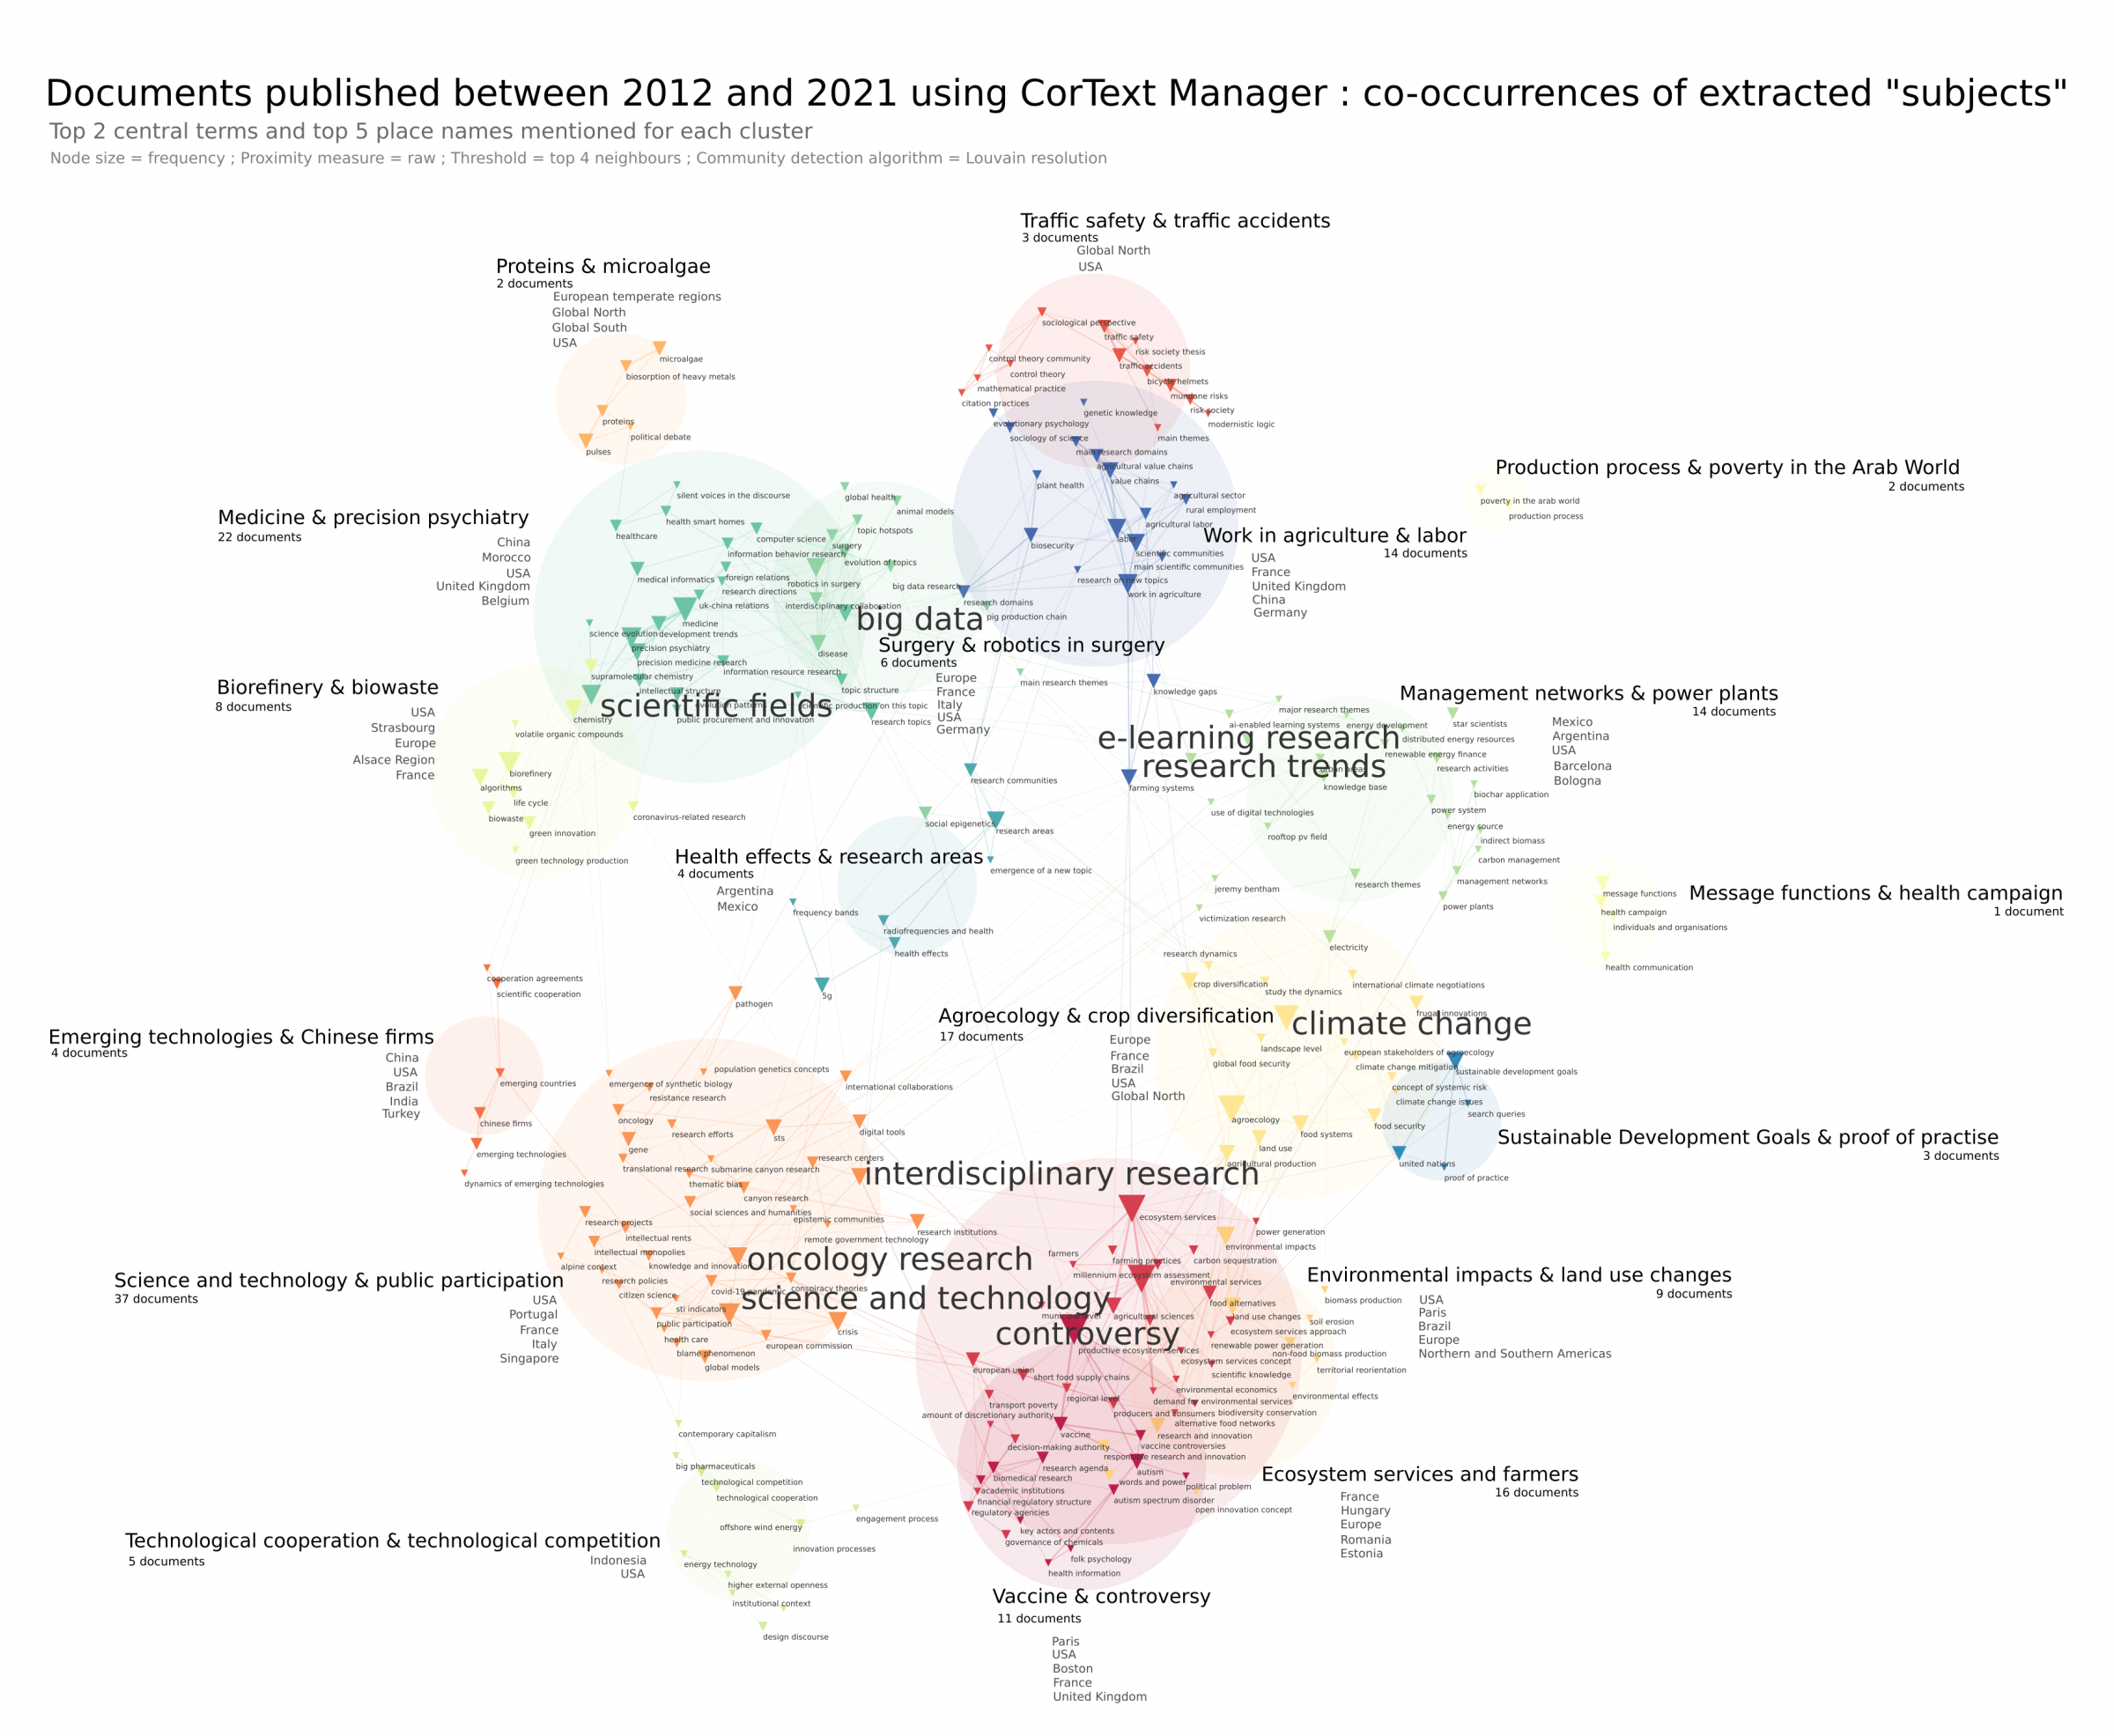
Parameters used for this network mapping (click on the parameter to have more information)
Proximity measure = raw; Node size = frequency; Edges’ threshold = Top 4 neighbours; Community detection algorithm = Louvain resolution; Clusters’ tags = Top 5 place names mentioned (raw specificity measure)
This figure represents the map of cooccurrences of the terms corresponding to the subjects which were extracted from the titles and the abstracts of the documents. For each cluster, the 5 most frequently mentioned places have been added. The map highlights two major pools of studies:
- around the theme of agriculture and environment with 4 clusters grouping 56 documents (ecosystem services and farmers; environmental impacts and land use changes; agroecology and crop diversification; work in agriculture and labor),
- and around the theme of science and technology with 3 clusters of 46 documents (science and technology and public participation; emerging technologies and Chinese firms; technological cooperation and technological competition).
The rest of the map is fragmented, it shows 11 other clusters that group together mostly few documents. These clusters cover a wide range of topics as shown by the two most central terms of each cluster (ex: biorefiniey and biowaste; medicine; traffic safety…). Concerning the place, they are also very varied, even within the same cluster.
In conclusion and looking at the temporal distribution of topics as well as the elements shown above, the documents published by CorTexT Manager users deal with a wide variety of topics.
What sources of data did the authors work on and what methods did they mention?
Parameters used for this network mapping (click on the parameter to have more information)
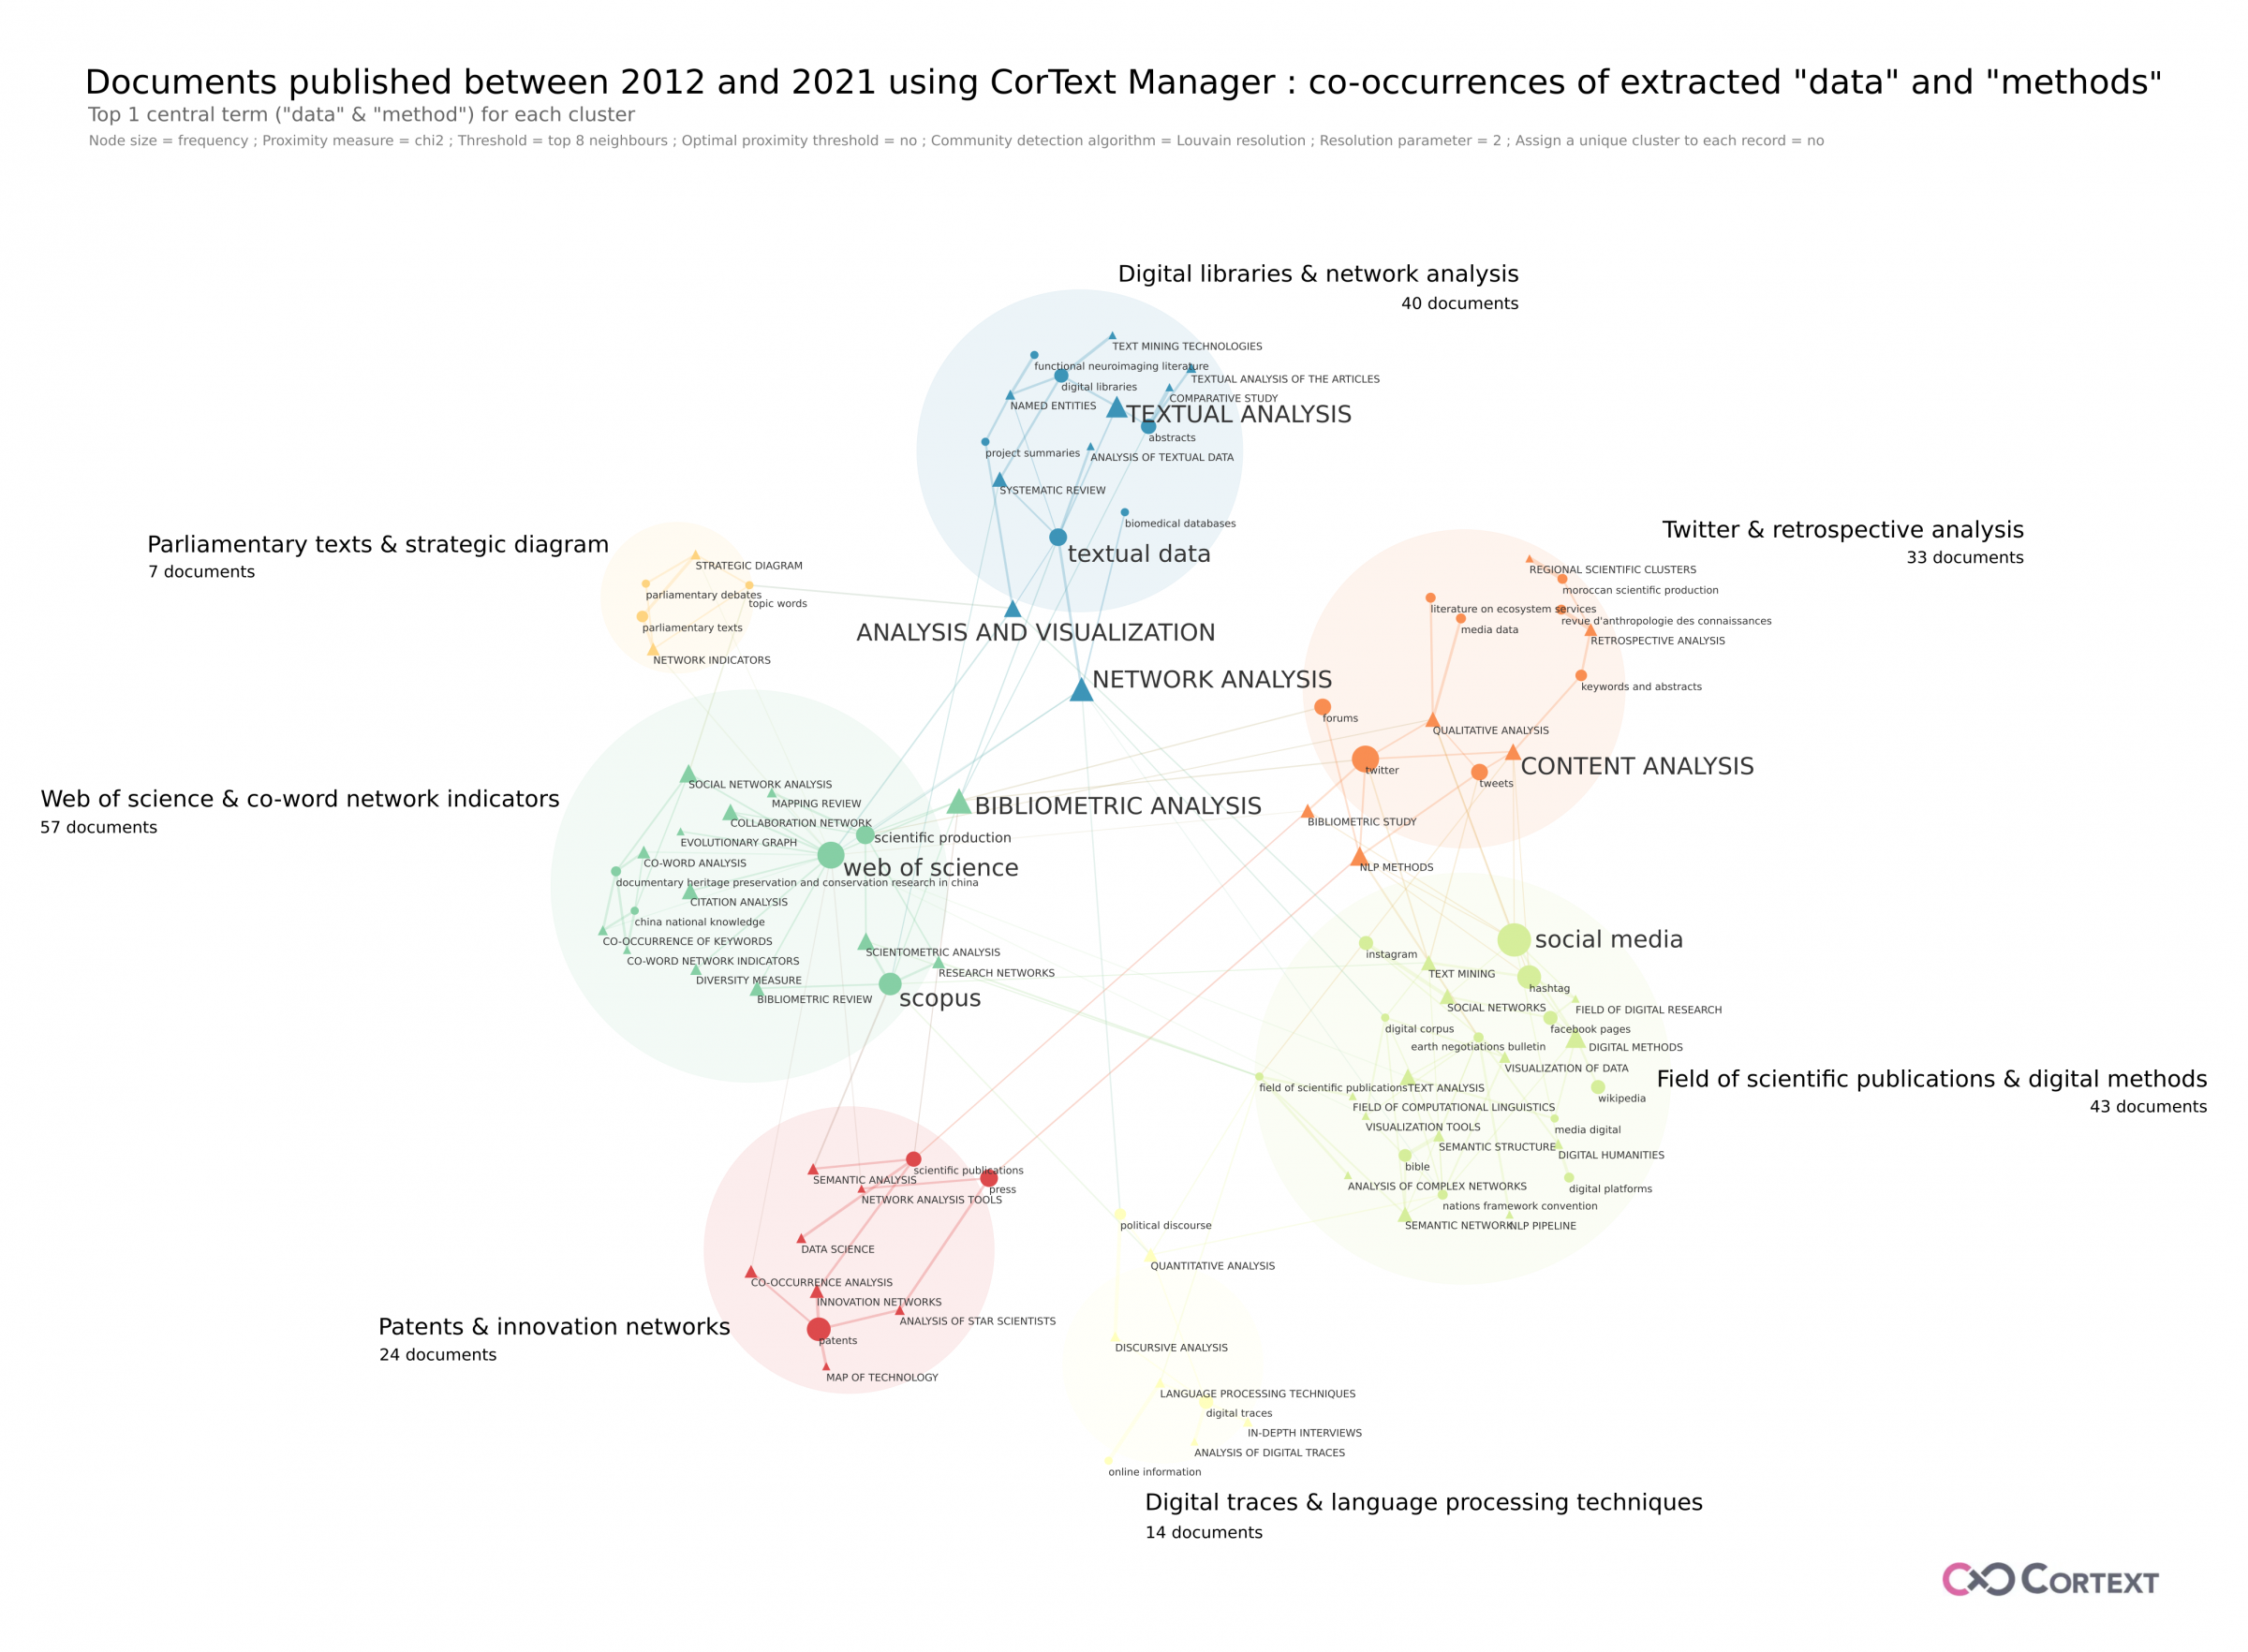
Heterogeneous map = first field:data, second field:methods; Proximity measure = chi2; Node size = frequency; Edges’ threshold = Top 8 neighbours; Optimal proximity threshold = no; Community detection algorithm = Louvain resolution; Resolution parameter = 2; Assign a unique cluster to each record = no
This figure represents the heterogeneous map of cooccurrences of the extracted terms corresponding to the data and the methods mentioned in the titles and abstracts of the documents. The aim is to see which methodological framework has been mobilised in the documents studied and whether specific methods are used for certain types of data. The vocabulary found in the documents is very diverse: different terms are used to describe similar concepts, which can be found in different clusters. However, some trends can be identified.
- The most important cluster in terms of number of documents includes in particular the data sources web of science, scopus, scientific production which are linked among other to the classical methods of scientometrics (social network, collaboration network, citation analysis, co-word analysis…) and to bibliometric analysis.
- The second cluster includes specific sources (such as the bible, earth negociations bulletin) associated with semantic analysis techniques among others, and includes also all social media (except twitter and forum) associated with among other digital methods, text mining and social networks methods. This cluster shares links concerning the content analysis, bibliometric study and NLP methods with the cluster including twitter and forums. This cluster, fourth in terms of number of documents, also contains other specific sources (ex: revue d’anthropologie des connaissances, moroccan scientific production) linked by the content analysis and the retrospective analysis methods.
- The third cluster is essentially about textual analysis methods related to textual data, abstracts, project summaries, digital libraries, functional neuroimaging literature and biomedical database.
- Then comes a cluster related to technometrics (innovative network methods, map of technology, co-occurrence analysis, semantic analysis, network analysis) with patent data and scientific publications.
Finally, we found two more little clusters, one dealing with the study of parliamentary texts and debates, and one on political discourse, online information and digital traces.