The aim of this map is to build a cartographic representation of drive times for freight transport companies. The method used is replicable, as an example the map shows the drive times from the 13th most important cities in Mozambique.
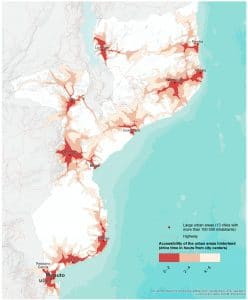
This model is based on an open source dataset of transport networks (OpenStreetMap, 2016) in Mozambique and the bordering countries. It simulates, at a fine-grained level, the behaviours of truck drivers by taking in account both barriers (one-way roads, pedestrian or cycling paths, tracks for agricultural purpose…), and the most frequent situations for drivers (time take for border, turns and U-turns, junctions, local road crossing a regional road…). The model define six classes of roads (from local roads to highways) for more than one million kilometres of roads, with specific average traffic speed empirically deduced from a sample of transit times of a Mozambican freight transport company. This complex network of more than 1 million of road sections is analysed with ArcGIS, in order to build drive time areas (2, 4 and 6 hours), from the city centres of the major urban areas (more than 100 000 inhabitants, GeoNames, 2016).
For further information, the detailed method can be found in French, or a short abstract in English.
The map illustrates the interconnections of these urban areas and the problems of accessibility of their hinterlands in term of land transportation.