GeoClust is a simple solution to study the geographical aggregation of activities. This is done by grouping coordinates (latitude and longitude) into clusters. This has been developed by members of the platform CorText for the RISIS project.
The software is based on two successive different approaches
Step 1: density-based analysis
First we use a density-based algorithm, DBSCan (Ester, Kriegel, & Sander, 1996), to identify the areas where the activities are concentrated. Following the original algorithm two parameters are fixed before the calculation: all points of a cluster are surrounded by at least X points in a circle with a diameter of Y km. We have added the ability to weighted each X points; the software examines the quantity of activities for each couple of coordinates. This step builds initial clusters.
Step 2: relational and structural analysis
The second step builds the final clusters by using the CHAMELEON method (Karypis, Han, & Kumar, 1999). The software compares two different dimensions of the initial clusters (relational and structural analysis) to merge them if the thresholds are reached:
- RI or Relative Interconnectivity: how intense are the relations between the initial clusters (with less than 100 km between the centroids)?
- RC or Relative Closeness: does the final cluster will have a similar profile of collaborations than the two initial clusters taken separately (to avoid large variations of density of links in the final cluster)?
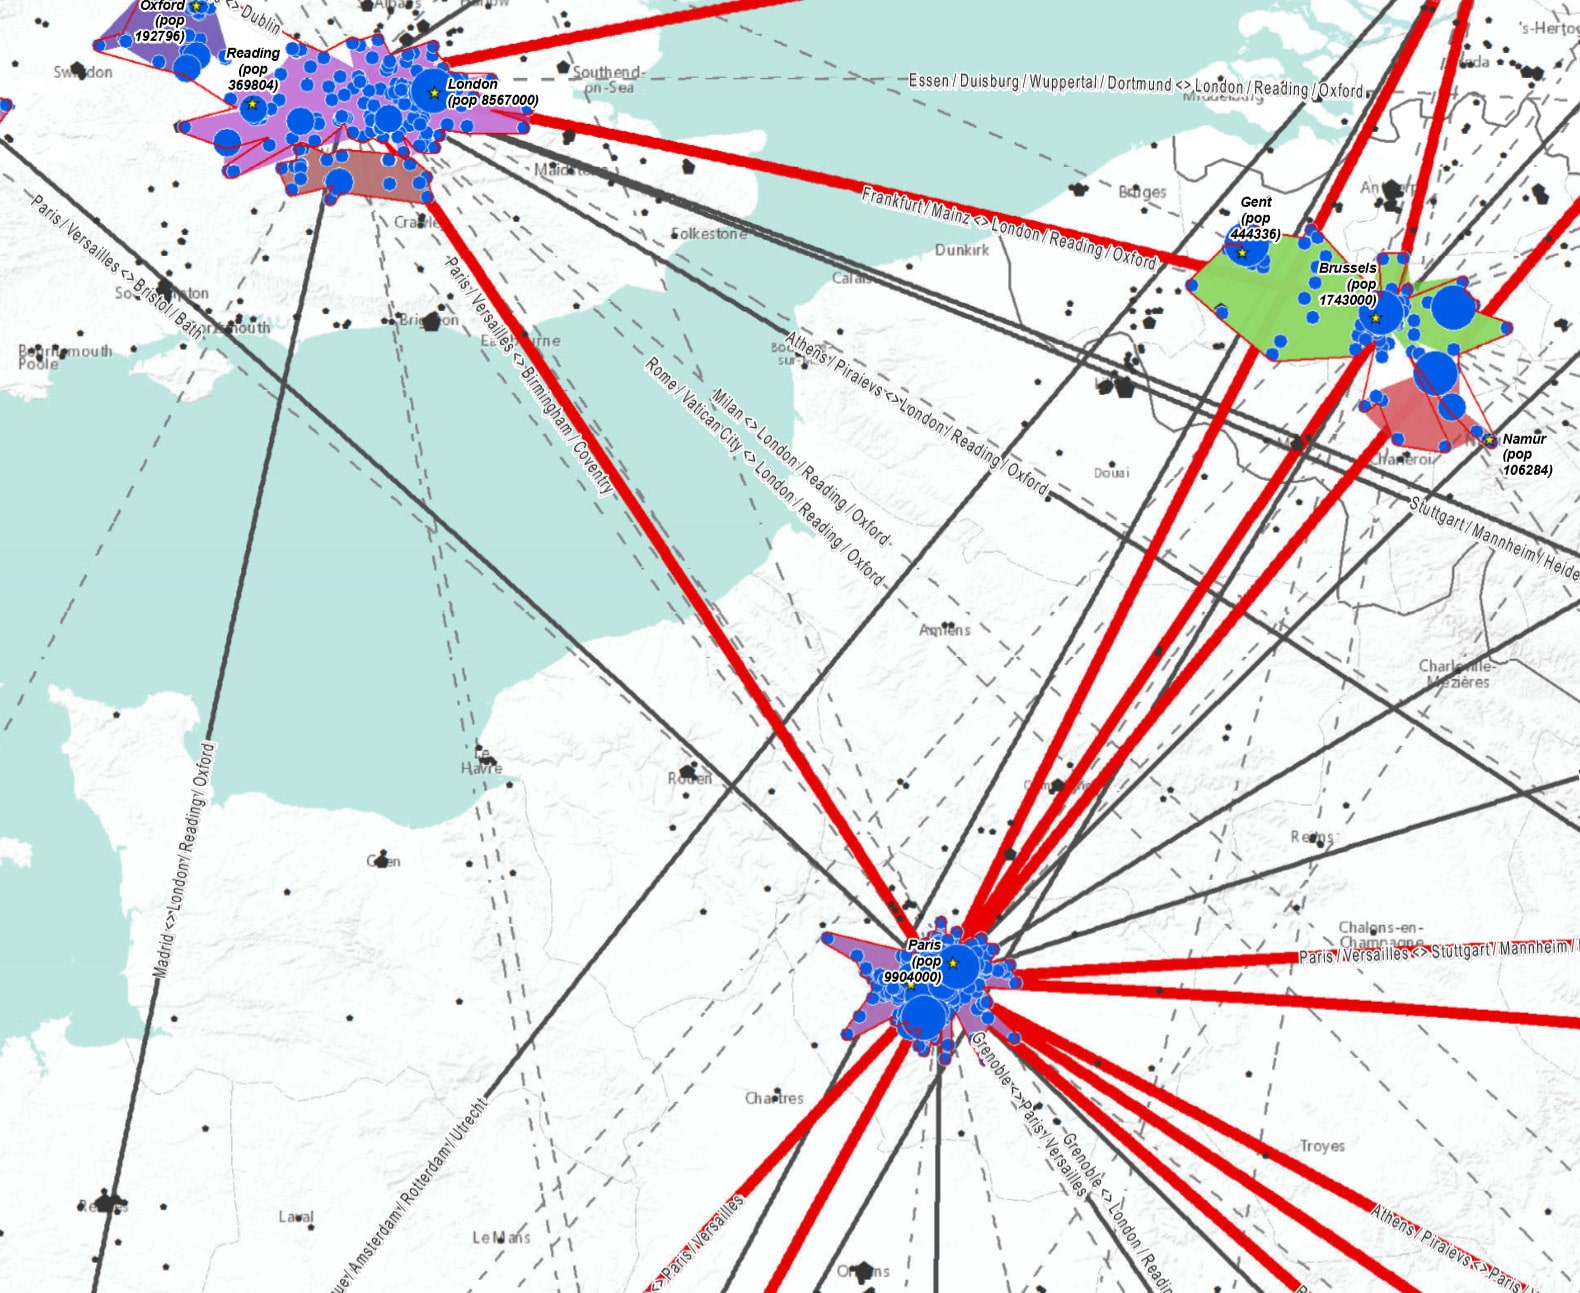
This map is used only for illustration purposes, GeoCluster won’t help you draw the map, neither the relations between the clusters (even if, both points and relations are used for the algorithms).
Examples of results
All the results files are stored in the example folder. The parameters used are: 25km with a minimum of 150 for the weight of the longitude-latitude couples, and 0.28 for RI and 0.32 for RC.
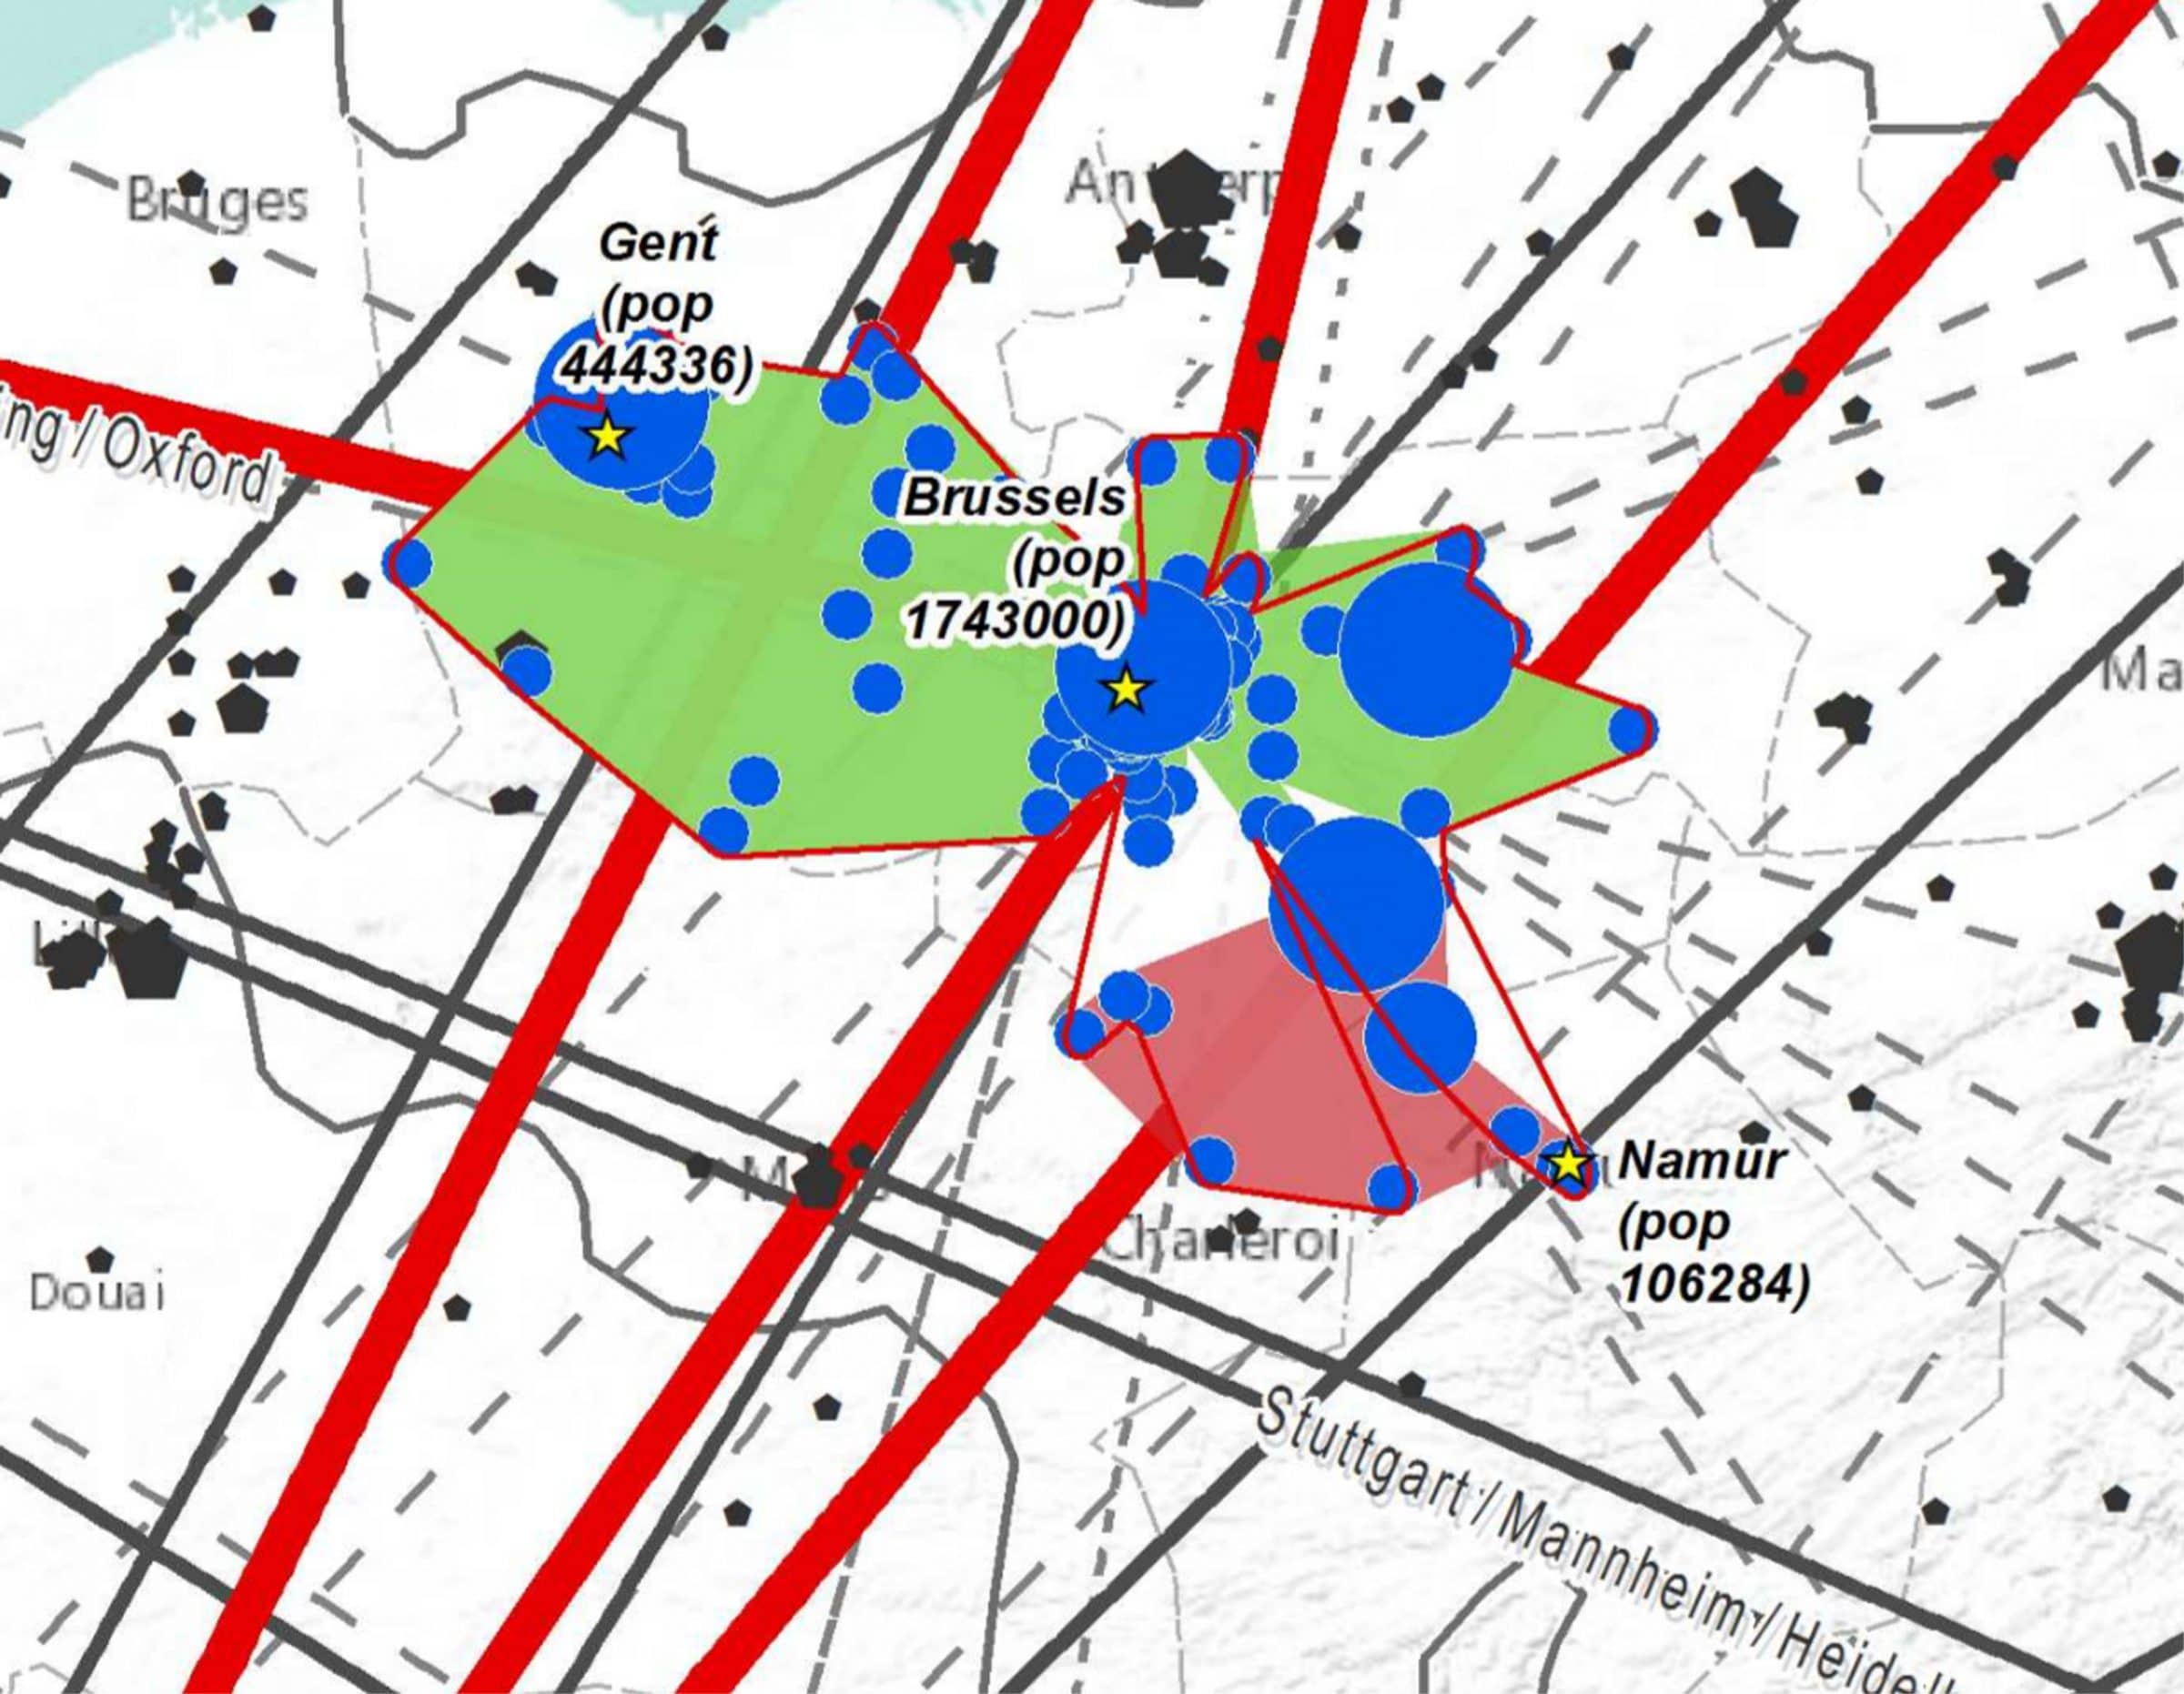
In this example:
- Two initial clusters were built based on the density analysis : one for Brussels with Gent (green), and a second one around Namur (pink)
- One final clusters was built based on the relational (relations between the two clusters) and structural analysis (comparison of the internal relations of the two clusters): the two intial clusters were merged (red line)
- All the blue dots belong to the final cluster
- All the black points are outside clusters
How to use
- Import the project into Eclipse;
- Add the jar libraries found into the folder external-libs;
- Be sure you created a MySQL database, and that the MySQL server is running;
- Run the java class InterfaceBD.
Input CSV file format
The input csv file should be tab separated with a \n at the end of the lines. Have a look here to see more.
To use the csv file you must follow the next format : Article id, article year, latitude, longitude.
- IDb : a unic number to identify the articles (repeated if there are some relations inside articles);
- Year : if the a temporal (year) information does not exist or if you do not want tu use it, you should fill-in this column by 0;
- Latitude : this field is request;
- Longitude : this field is request.
Export the results from MySQL server
The GeoClust software creates some useful files to understand the geographical clusters produced. See the example folder. But if you want to directly link the ID of your documents and the results you can query the final data and produce a table with all the relevant information you will need to work outside GeoClust. Use one of these queries directly in your MySQL instance:
-- All information for clusters with a weight for each latitude-longitude couples
SELECT
    a.IDc,
    a.Latitude,
    a.Longitude,
    a.nbArticles AS NbDocuments,
    a.IdClusterDbScan,
    a.IdClusterCham,
    a.isFusion
FROM
    geoclust.ww_resultatclustering AS a;
-- All clusters's information for each document
SELECT
    b.IDb,
    a.IDc,
    a.Latitude,
    a.Longitude,
    a.IdClusterDbScan,
    a.IdClusterCham,
    a.isFusion
FROM
    geoclust.ww_resultatclustering AS a
        INNER JOIN
    geoclust.ww_pruebadata AS b ON a.IDc = b.IDc;
Performace
On a computer with a 2.4GH processor (i7) and 8 GO RAM, with tow rounds of merging (chameleon):
- it takes around 8 minutes for around 15 000 relations between coordinates with 6 000 distinct weighted coordinate couples.
- it takes around 30 minutes for around 30 000 relations between coordinates with 18 000 distinct weighted coordinate couples.
More information on the algorithms
Ester, M., Kriegel, H.-P., & Sander, J. (1996). A density-based algorithm for discovering clusters in large spatial databases with noise. In S. Evangelos, J. Han, & U. M. Fayyad (Eds.), 2nd International Conference on Knowledge Discovery and Data Mining (KDD-96) (pp. 226–231). AAAI Press.
Karypis, G., Han, E.-H., & Kumar, V. (1999). Chameleon: Hierarchical clustering using dynamic modeling. IEEE Computer, 32(8), 68–75.
Lionel Villard, ESIEE Paris, CorText Platform, Paris Est University
Michel Revollo, ESIEE Paris, Paris Est University