As an output from RISIS project funded by EU commission, we have investigated what are the impacts of funding on the geographical spaces where are located the productions of nano S&T.
Based on a worked done by Lionel Villard (ESIEE–IFRIS), François Perruchas (INGENIO), Thomas Scherngell (AIT), Michael Barber (AIT), Philippe Larédo (Université Paris-Est, ENPC–IFRIS) and Jordi Molas-Gallart (INGENIO)
There are multiple on-going debates about the geographical distribution and concentration of knowledge production worldwide. Recent work done by Grossetti et al. (2015) points to a ‘deconcentration’ process of knowledge production, visible not only at country level (linked to the periodic rise of new countries in the overall scientific production landscape, a long-lasting phenomenon), but also at metropolitan level. In a European policy context, this raises the question whether we can also identify such tendencies across the European territory, and whether this specifically applies to frontier scientific fields.
In this demonstration, we have addressed this question for knowledge production in the field of Nano sciences & technologies (S&T), accounting for different kinds of knowledge production (scientific, technological and project-based). The attempts to characterise the dynamics of Nano S&T are not new (Noyons et al., 2003). One pre-condition for the empirical analysis of Nano S&T is its delimitation in relevant R&I datasets. Kahane and Mogoutov (2007) have developed a fully lexical approach which remained however static (considering only the whole period covered). This has meanwhile been advanced to a ‘dynamic‘ approach (Kahane et al., 2014) where the lexical delineation evolves each year according to the field specific vocabulary produced.
The exploration of the first Nano S&T dataset (1998-2006) enabled a characterisation of dynamics highlighting very strong agglomeration effects since 200 ‘clusters’ (very near in their bottom-up definition to the US definition of metropolitan areas and to the OECD recent developments on “functional urban areas”, OECD 2012) account for over 80% of world knowledge production in terms of publications (Delemarle et al., 2009). This provides an immense different picture as when looking at the national level, even more corroborating a spatial ‘deconcentration’ process. As 70% of these publications come from more than one organisation, we hypothesised that a majority of these inter-organisational co-authorships might be internal to clusters; this was the case but to a far lower extent than expected, having 40% of total publications being inter-cluster.
Characterising collaboration practices in Nano S&T (Larédo and Villard 2015) drove to two major results. First, the share of intercontinental collaborations remained marginal (around 8% of total collaborations). This drove us to focus on the 80 European clusters and their collaborations dynamics per se. It showed that inter-country links are more important than intra-country ones, once account is taken of one central phenomenon: the very ‘national’ structure of linkages within the UK. This may also explain as well why, probably for the first time in science history, neither Oxford nor Cambridge play central roles in the European dynamics of science production. They are replaced by ‘newcomers’ at world level, such as Louvain, Julich or Grenoble.
This very European nature of collaborations and networks in turn drove us to consider the role that European funding might play in this concentrated but geographically distributed knowledge production pattern. While there are numerous works on the spatio-temporal dynamics of European funding, and more specifically for the European Framework Program (FP) (see e.g, Scherngell and Barber 2011, Scherngell and Lata 2013), there are few empirical works that relate European funding to the spatial distribution of knowledge (see e.g. Hoekman et al. 2013, Di Cagno et al. 2016, Wanzenböck and Piribauer 2018).
Against this background, the objective of this demonstration is to characterise the spatial distribution of Nano S&T knowledge production and EU research funding at the level of European urban areas. Furthermore, we aim to shed some light on the role of FP funding for knowledge creation in Nano S&T.
Our conceptual approach is built on two distinct dimensions of knowledge creation:
- one linked to exploration and the spreading of excellence,
- and another associated with knowledge exploitation, i.e. the development of exploitation capabilities.
We use scientific publications are markers of exploration and patents are used to follow exploitation (technology). The spatial distributions of publications vs. patents differs remarkably across the European territory (Laredo et al., 2010) with, for example, the UK playing a strong role in publications, while Germany plays a major role in patents.
Methodology & data
In our empirical approach, three different datasets have been used:
- EUPRO, so as to obtain the European funding on Nanotechnologies. EUPRO contains information about all research projects funded by the FP (FP1-H2020), including the project title, keywords, description, amount of funding, participants, etc. We searched in this database for a set of keywords to identify projects related to Nano S&T, and have geocoded the addresses of each participant. We extracted projects from FP5, FP6 and FP7 for this demonstration.
- NANOPUB, which contains all the scientific publications in the Web of Knowledge database about nanotechnologies (a proxy for knowledge exploration in this field). Thanks to the support of the RISIS project, the addresses of the author’s institution are already geocoded.
- NANOPAT to have all the patent families filed in nanotechnologies (a proxy for knowledge exploitation). In this database, the patent localisation is obtained through addresses, which are already geocoded again thanks to the support of RISIS.
Traditional approaches are usually based on administrative boundaries (NUTS, municipalities) and, thus, neglect the geographical continuity of socio-economic phenomena, such as S&T production. Therefore, we have chosen to use Functional Urban Areas (FUA) as more appropriate units of analysis; they are constructed using journey-to-work data, which creates an entity representing local economies with a higher fidelity than using administrative boundaries that largely vary across countries. For our analysis, we use a set of 688 FUAs across Europe (located in the EU-28 and associated countries) to trace FUA-level knowledge production and funding in Nano S&T. To trace the main transnational collaborations, also some larger extra-European countries are included.
To estimate the European funding in each FUA, the amount of funding received for each project, as available from EUPRO, is divided by the number of participants and the number of years. This value is then assigned to the FUA containing the geographical coordinates of the participant in each year during the project. To calculate the number of publications and patent families, we count respectively the number of authors and inventors geocoded inside a FUA, year by year, using the publication year for the scientific papers and the filling year for the patents. We construct our three FUA-by-FUA Nano S&T networks by counting the interactions between FUAs at an aggregated level both for EU funding (i.e. joint projects between organisations located in different FUAs), and for knowledge production (co-publications in terms of knowledge explorations, and co-patenting in terms of knowledge exploitation).
After these data preparation work, we look as a first exploratory step on the geographical distribution EU funding of NANO S&T at the level of FUAs, in relation to their knowledge production activities, disaggregated by exploration (publications) and exploitation (patents). FUAs are classified in two categories: ranked by the amount of European funding received during the whole period 2000-2011, the ones in the first 10% (from yellow to red) and the ones in the last 90% (from white to blue).
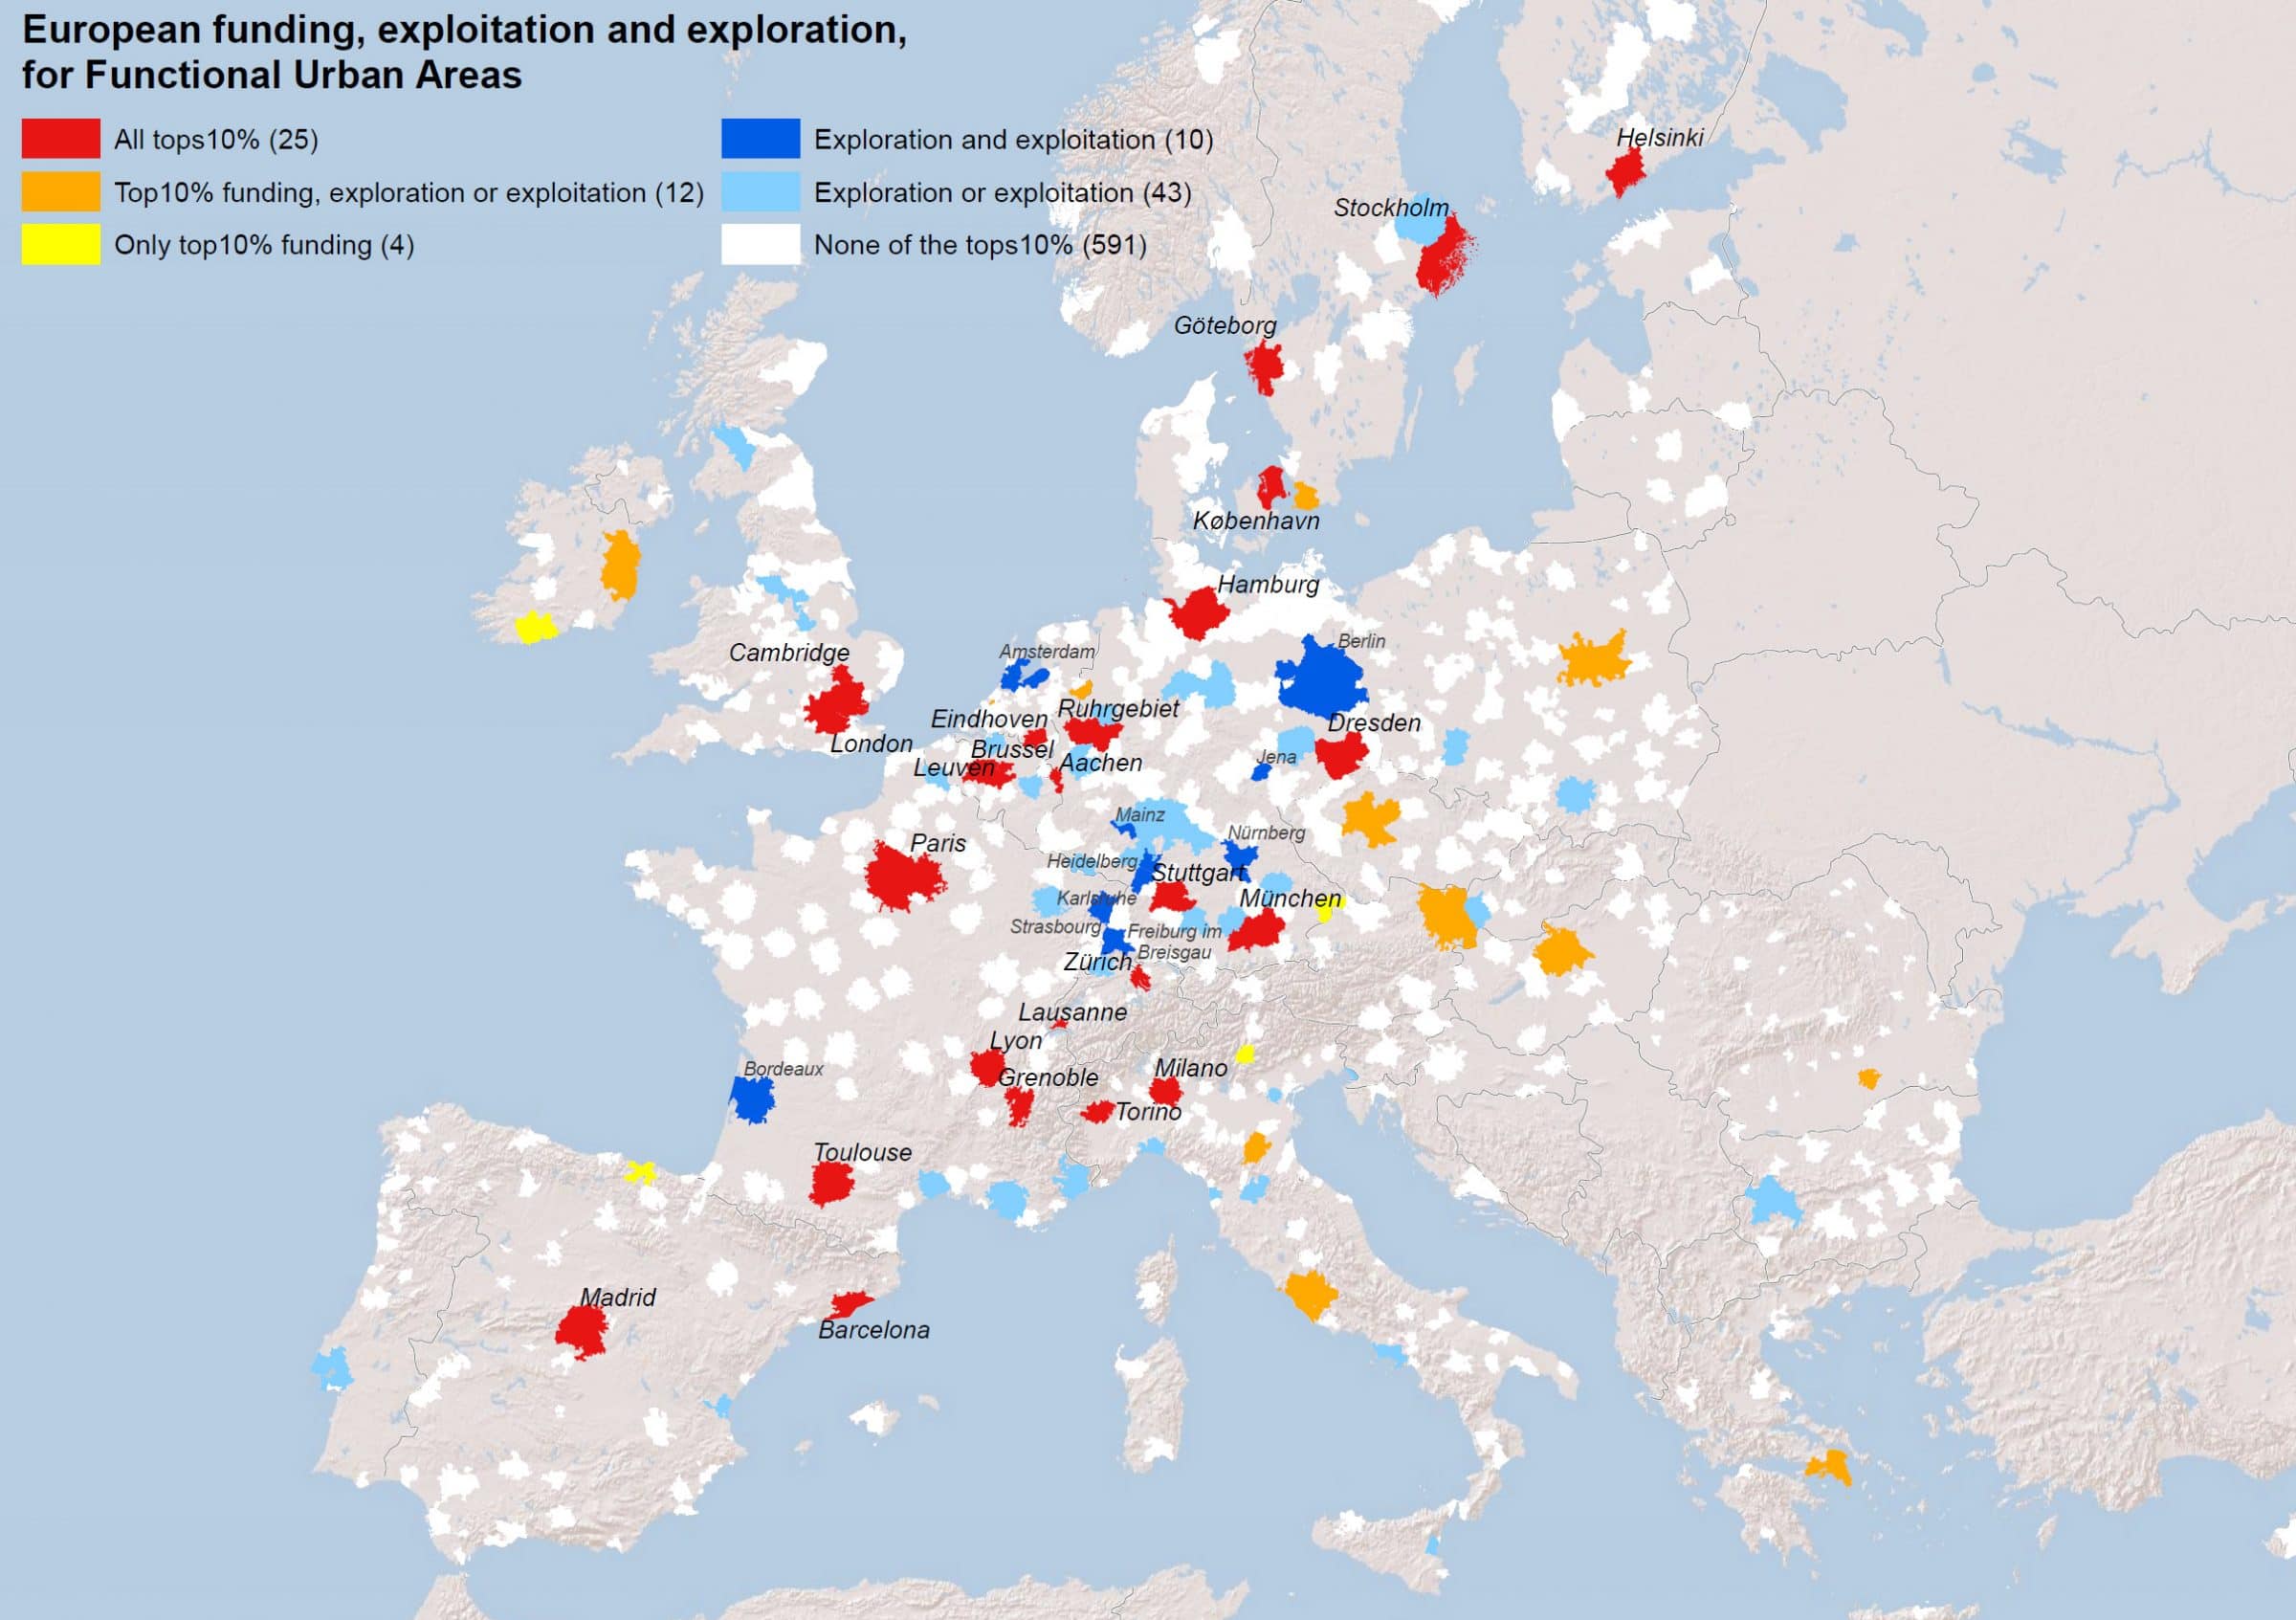
Then inside these two categories, FUAs are classified according to their performance in terms of knowledge exploration and exploitation, again setting a threshold at the top 10%. Interestingly, only 25 of all FUAs are under the 10%, both in funding and the two knowledge production processes (regions marked in red). In other words, by far not all FUAs that receive a large amount of funding belong to the top performers in terms of knowledge production. On the other hand, some FUAs are performing very well in both exploration and exploitation without received so much funding (in purple). These are highly interesting patterns and call for more in-depth analysis on the relation between funding and knowledge production. We do so in what follows, first by mean of a social network perspective, and then by mean of explanatory econometric framework statistically estimating the average impact of funding on knowledge production.
A network analytic perspective
The drivers of the exploratory findings highlighted above can be to some extent be explained by employing a network analytic perspective, in particular by means of so-called network community detection techniques (Blondel et al., 2008, in CorText Manager) on the three different networks (collaboration in projects, in publications and in patents). Network communities are parts of the network that show high internal interaction intensity, while interaction between communities is comparably lower (in magnitude). We detect communities in the inter-FUA research networks based on Blondel et al. (2008), assign each FUA to a certain community, and then classify within a community each FUA to one of the following three categories, following the “winner takes all” principle (Beauguitte et al., 2016; Nystuen et al. 1961), where:
- Core FUAs (black): FUAs dominating all the connected FUAs of their community;
- Peripheral FUAs (white): are dominated in all their relations;
- Intermediary FUAs (grey): dominate peripheral FUAs but dominated by other FUAs.
The result of the community detection show that each network is behaving in a different manner: for FP projects, collaboration through time is not building communities, and all the hubs are interconnected. This is not surprising given the governance rules exerted by the EU that are very much focused on cohesion and transnational collaboration. In contrast, in knowledge exploration, the communities are structured according to countries or to languages for English and Spanish, i.e. communities tend to be intra-national or within same language areas. In terms of knowledge exploration, the central part of Europe is structured around a strong “belt”, but a lot of collaborations are dominated by outer European FUA (mainly in the United States). These patterns can also be seen when looking at the overall spatial networks maps for the three networks under consideration below.
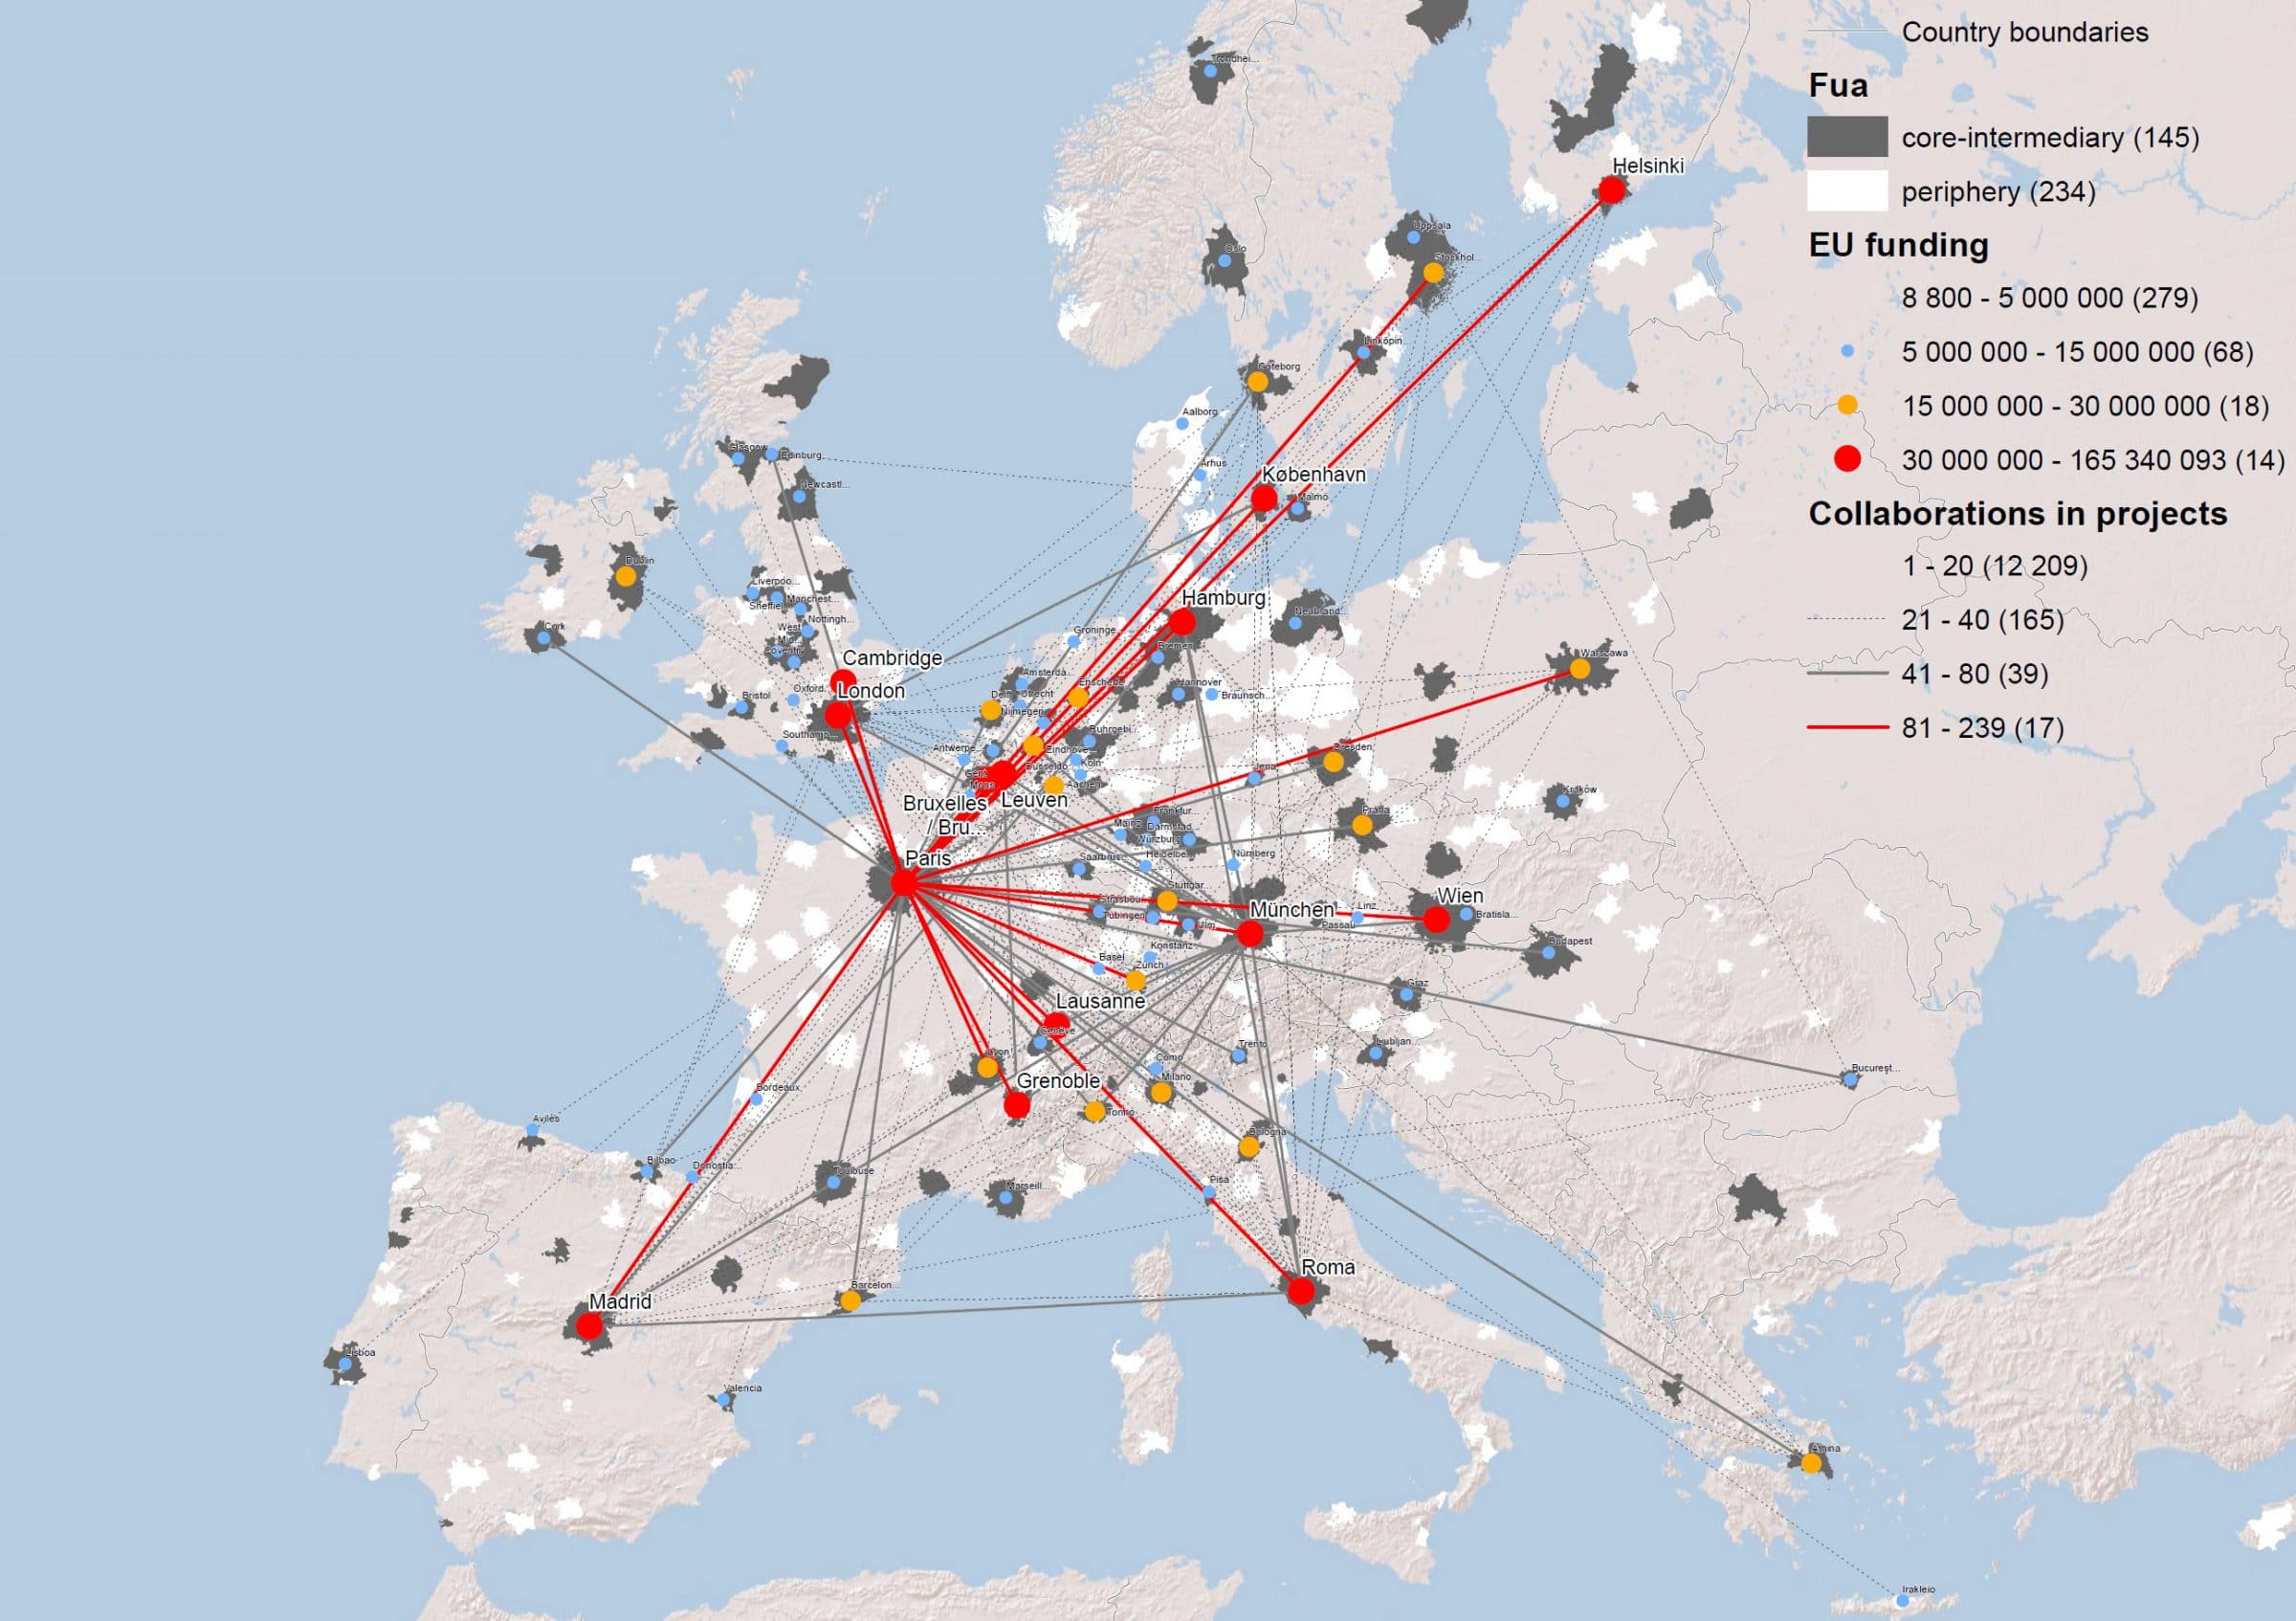
Network of participations (EUPRO) Click here for the interactive map
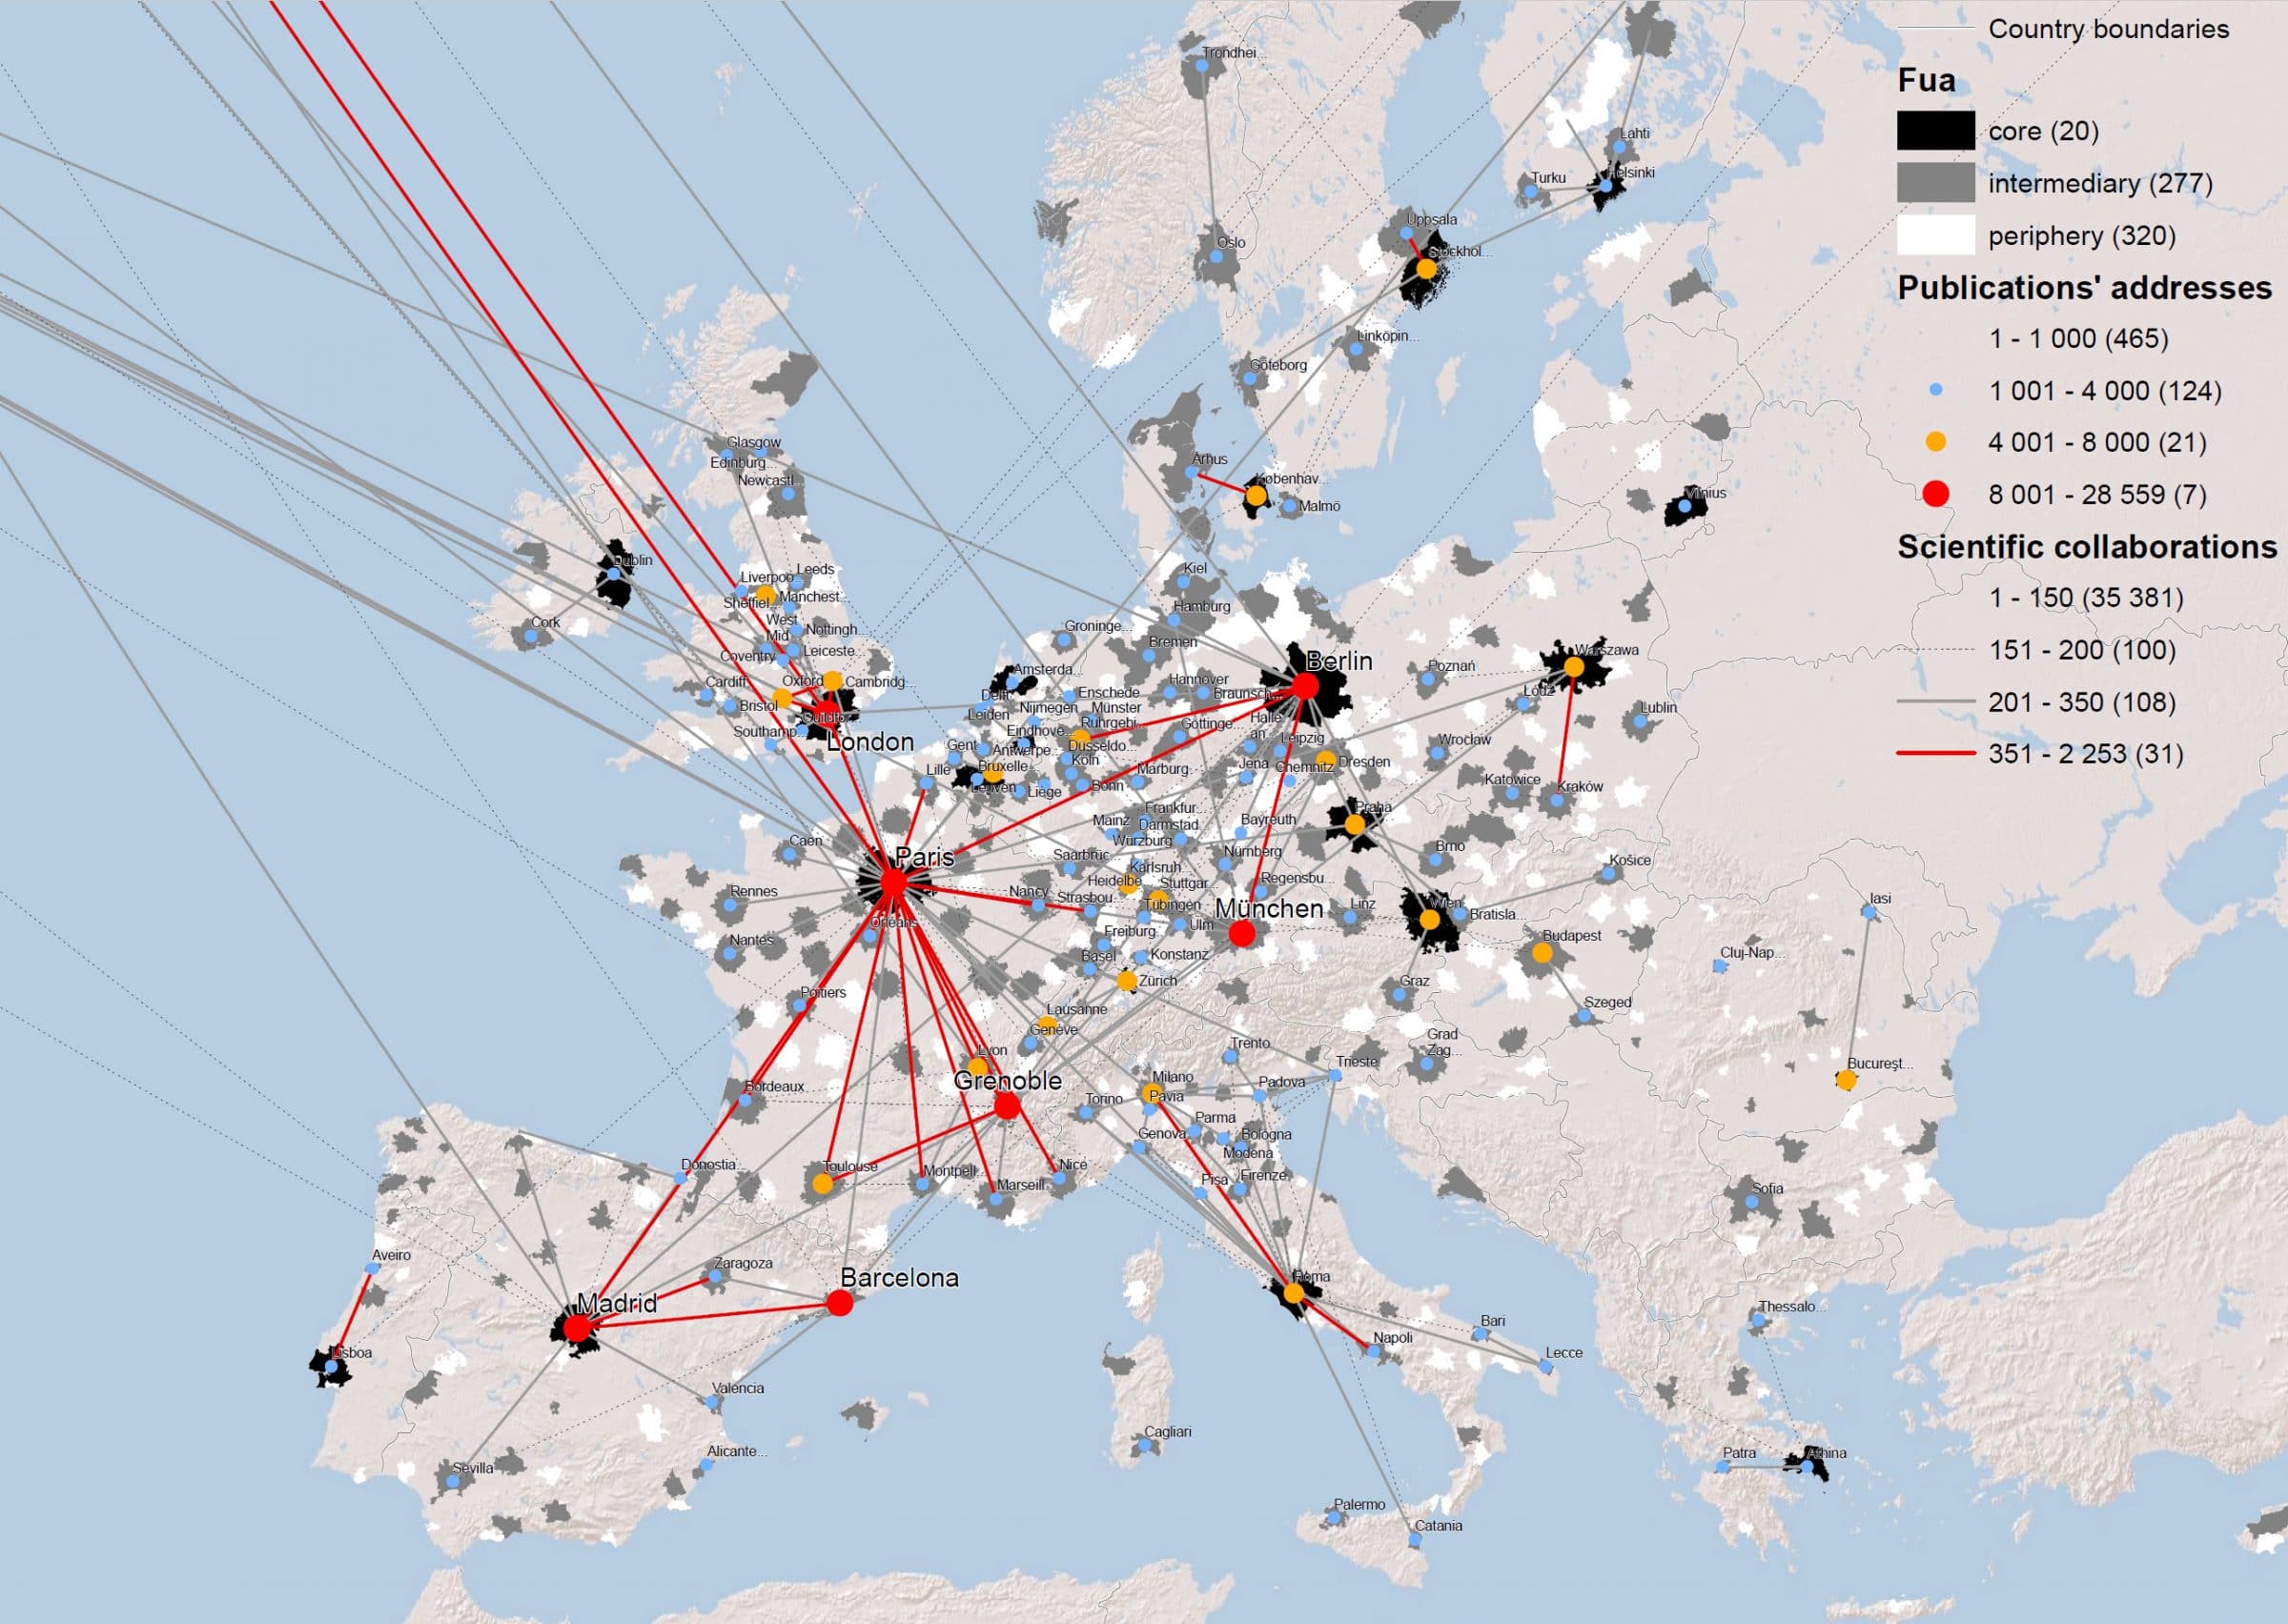
Collaboration network of authors (exploration) Click here for the interactive map
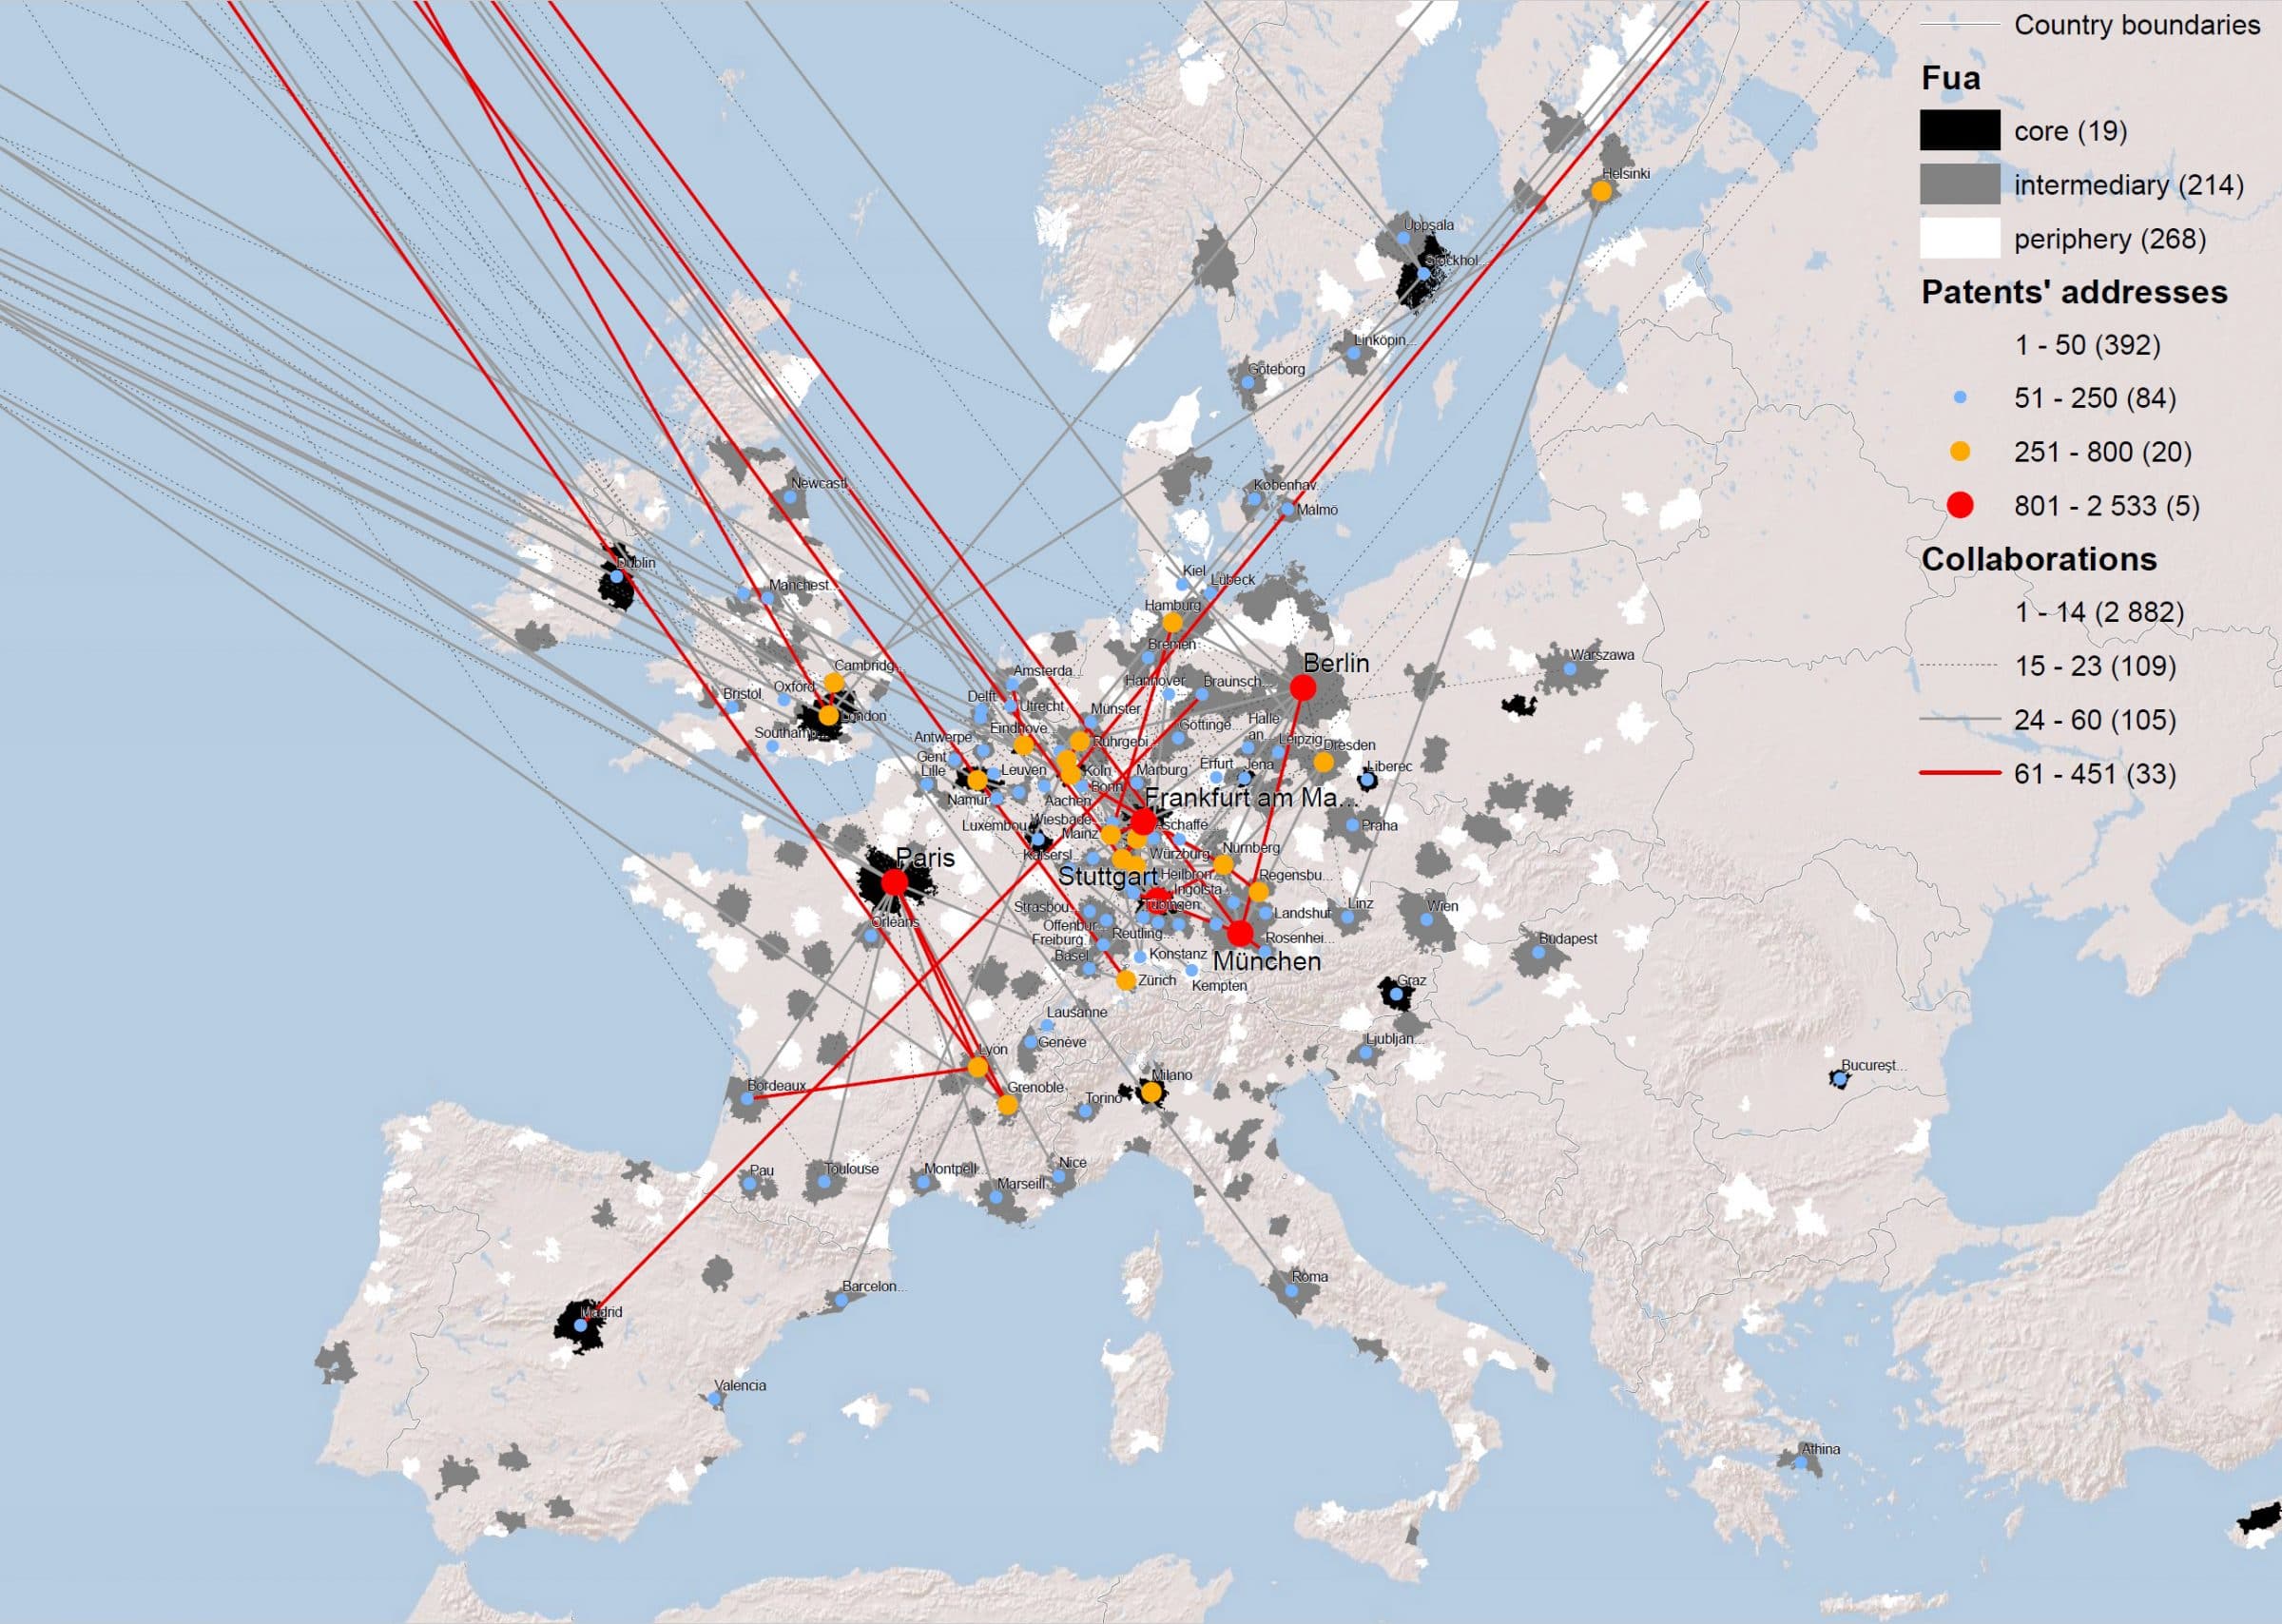
Collaboration network of inventors (exploration) Click here for the interactive map
An econometric perspective
The exploratory analysis above shows that the three networks under consideration differ in terms of their spatial dynamics. This raises the question whether we can find statistical evidence on the relation between funding and knowledge production. Shifting to an explanatory perspective, we employ an econometric modelling approach relating FUA-level EU funding to patents and publications while controlling for other intervening factors, such as GDP per capita, R&D expenditures or Number of PhD students. We build a panel dataset to specify a Panel Poisson model with heterogeneity, time fixed effects and a time lag of two years between the European funding and both knowledge exploration and exploitation outputs to address endogeneity issues.
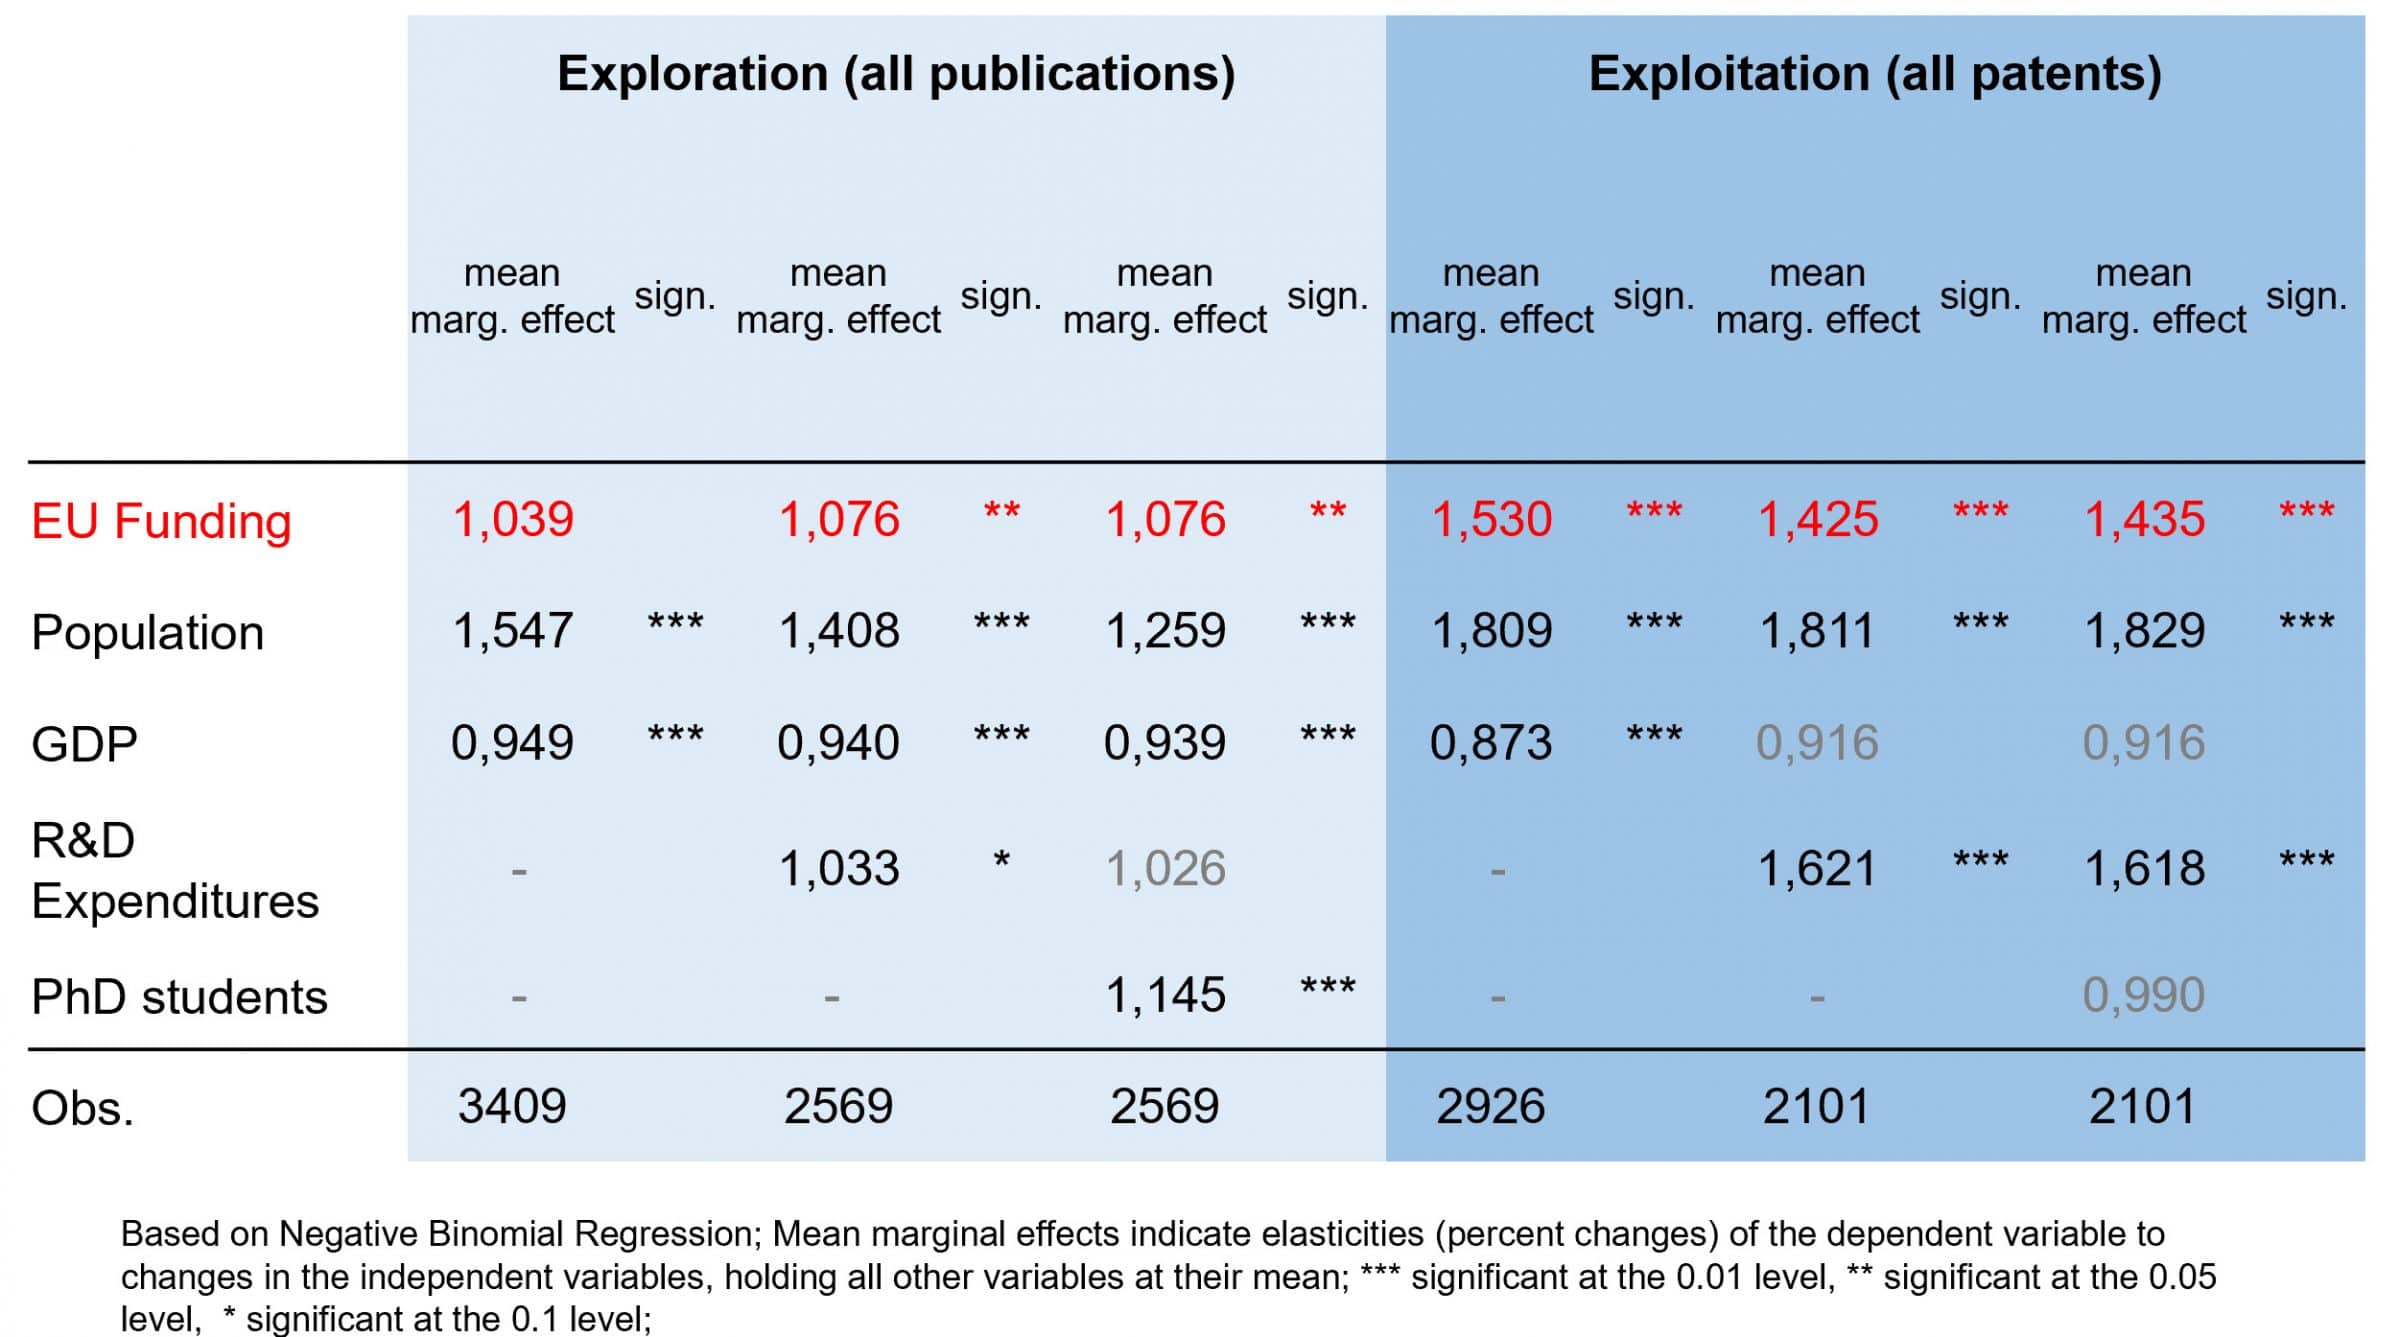
All observations
In a first model version (see above) we consider all the observations, confirming a positive and statistically significant effect of European funding on both knowledge exploration and exploitation. Moreover, it can be seen that the effects are slightly higher for exploration in all the models, quite robust also when adding step-by-step our control variables (GDP, R&D expenditures and PhD students).
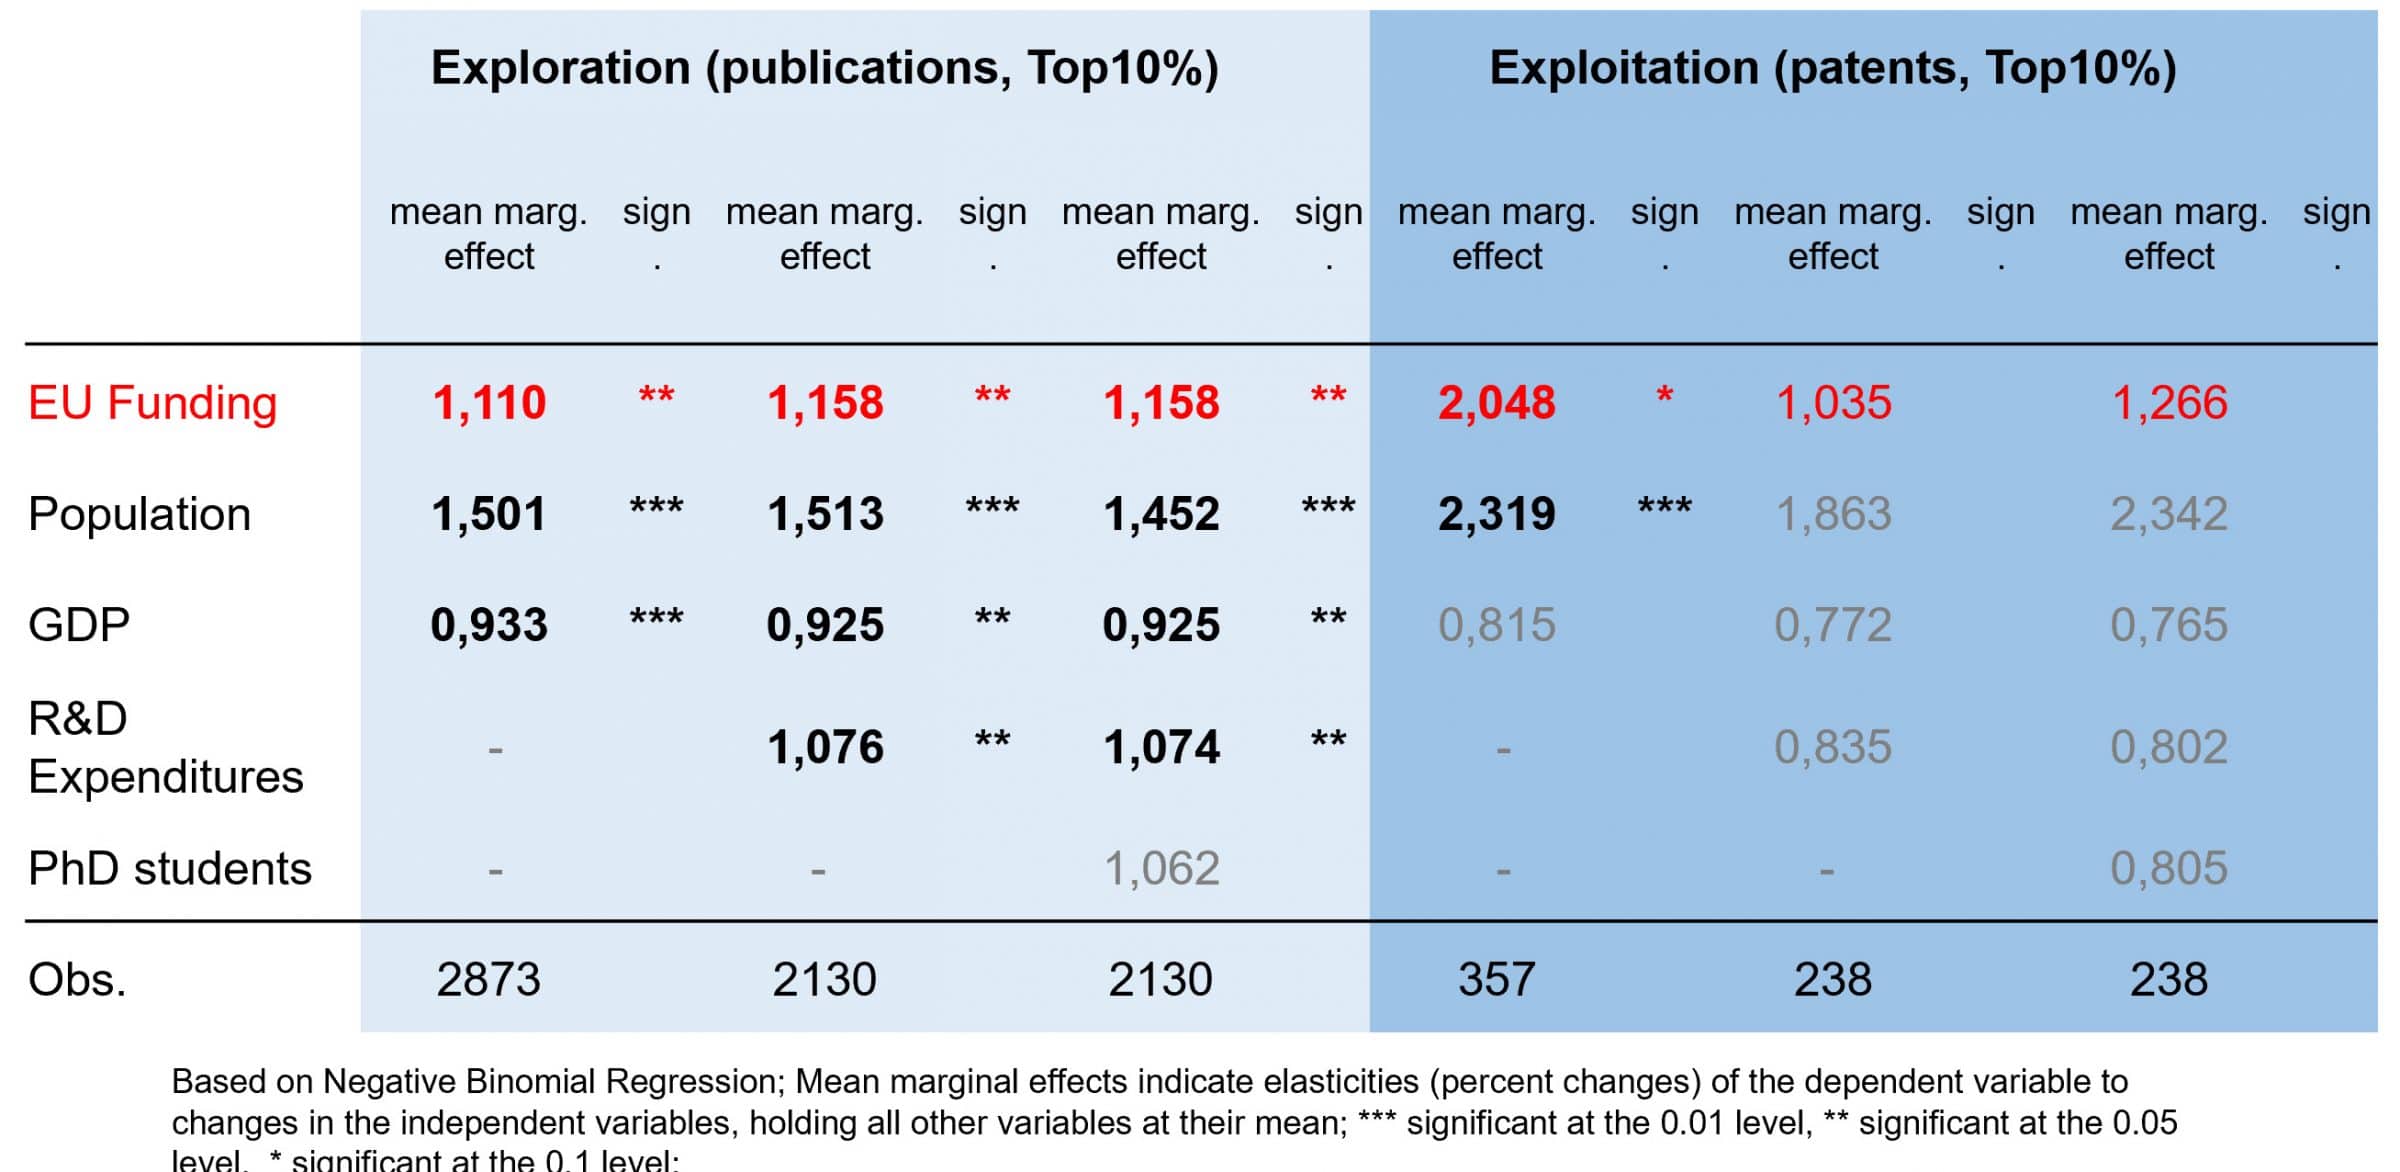
High quality (top 10%)
While the first model simply focuses on pure quantity of knowledge production, the second model version tries to go beyond and provide some insight about the quality of the knowledge outputs. Thus, the second version uses only the number of high quality knowledge exploration (the most cited nanotechnologies publications – top 10%) and exploitation (the biggest patent families – top 10%) as dependent variable. Indeed, we find that the EU funding effects increase on knowledge exploration, but slightly decrease for exploitation. R&D expenditures become a highly significant determinant for exploration but is not significant anymore for exploitation, where model 2 and 3 lose have no significance at all, probably due to a small number of observations.
Concluding remarks
This demonstration has shifted attention to a systematic empirical investigation of the dynamics in European Nano S&T production in relation to respective EU funding. We focused on the characterisation of the spatial distribution of Nano S&T knowledge production and EU research funding at the level of European functional urban areas, and tried to get some statistical insight on the role of FP funding for knowledge creation in Nano S&T.
We find a number of promising and interesting results. First, EU funding, knowledge exploration and knowledge exploitation networks in Nano S&T differ markedly in terms of their spatial distribution and network topologies (communities, concentration). Second, while we find general statistical evidence for the positive impacts of EU funding on knowledge production, several other determinants play a role that may be strongly related to network topologic characteristics as underlined by the differing network communities. Third, EU funding effects are higher for exploitation in terms of quantity, but higher for exploration in terms of quality (highly cited publications).
These results do not only bear relevant policy implications, but also demonstrate the immense research potential when combining different R&I datasets in a systematic and innovative way (mobilizing the RISIS infrastructure). While the demonstration clearly has its limitations (e.g. neglecting spillover effects) and can be deepened and improved in several ways and along different routes in future research, it is to our knowledge the first work combining three large-scale R&I datasets in a systematic and innovative way to characterise and explain European knowledge dynamics.
Annexes
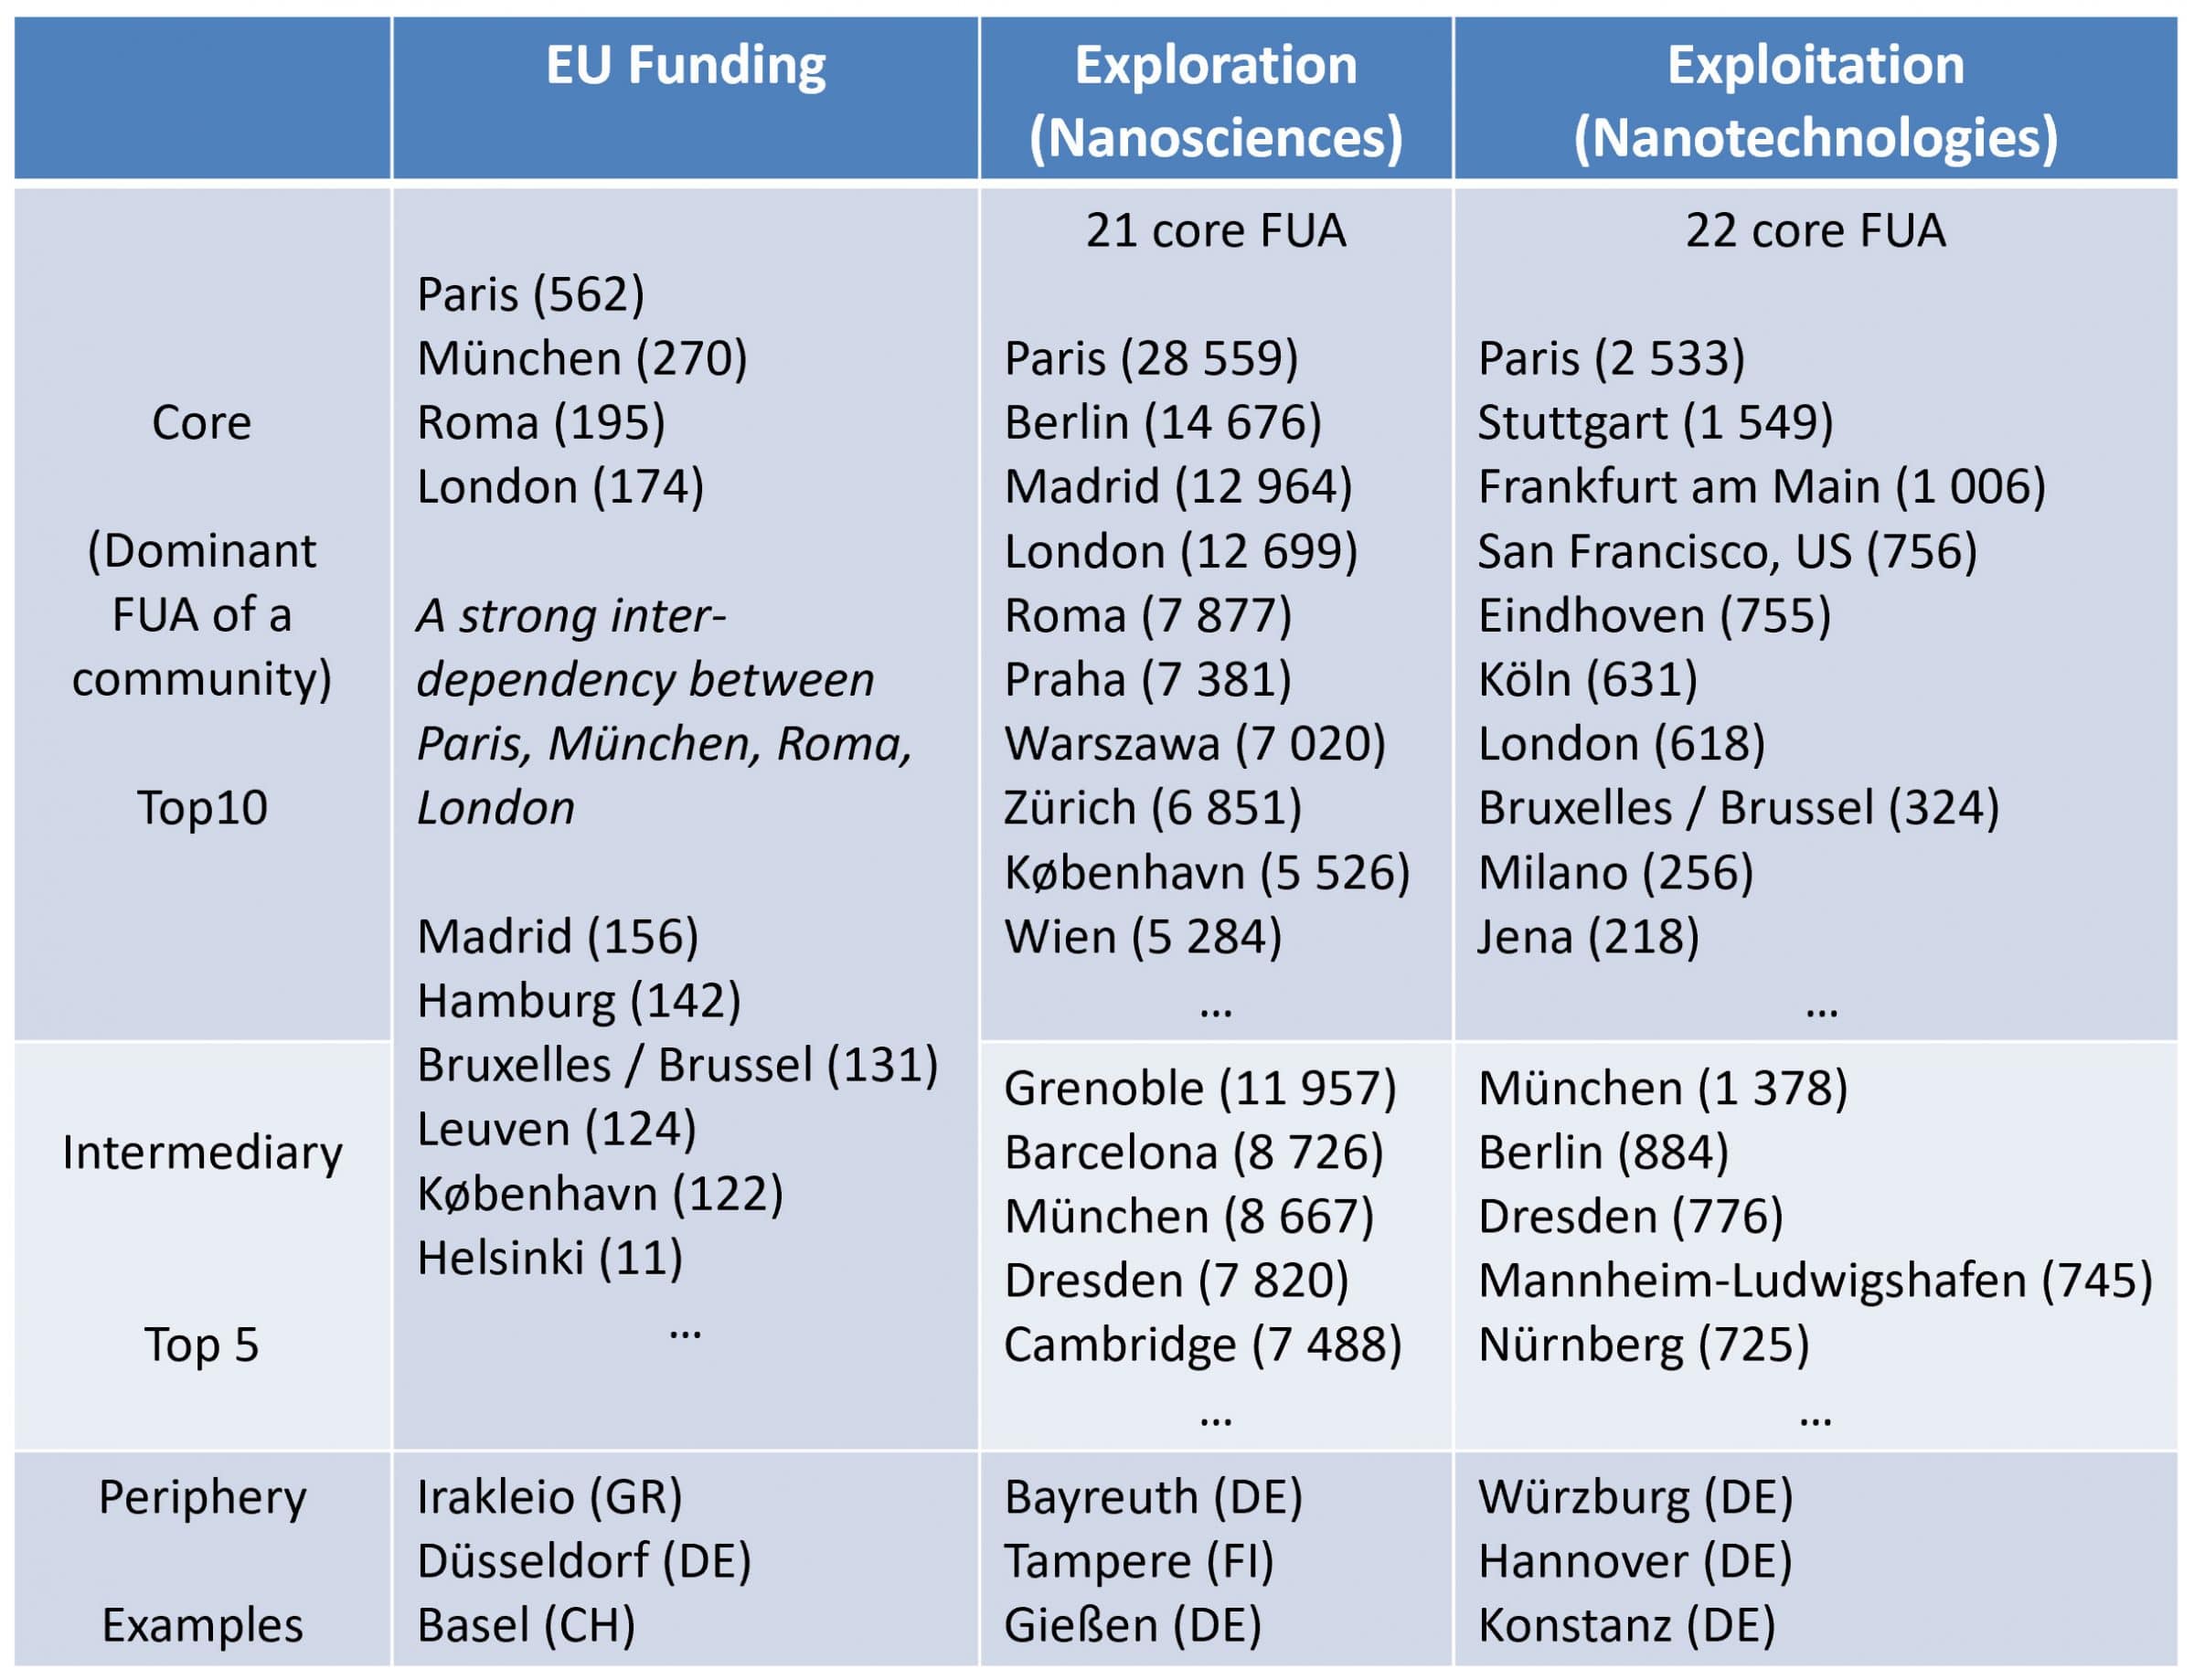
Synthesis of the classification of the FUA
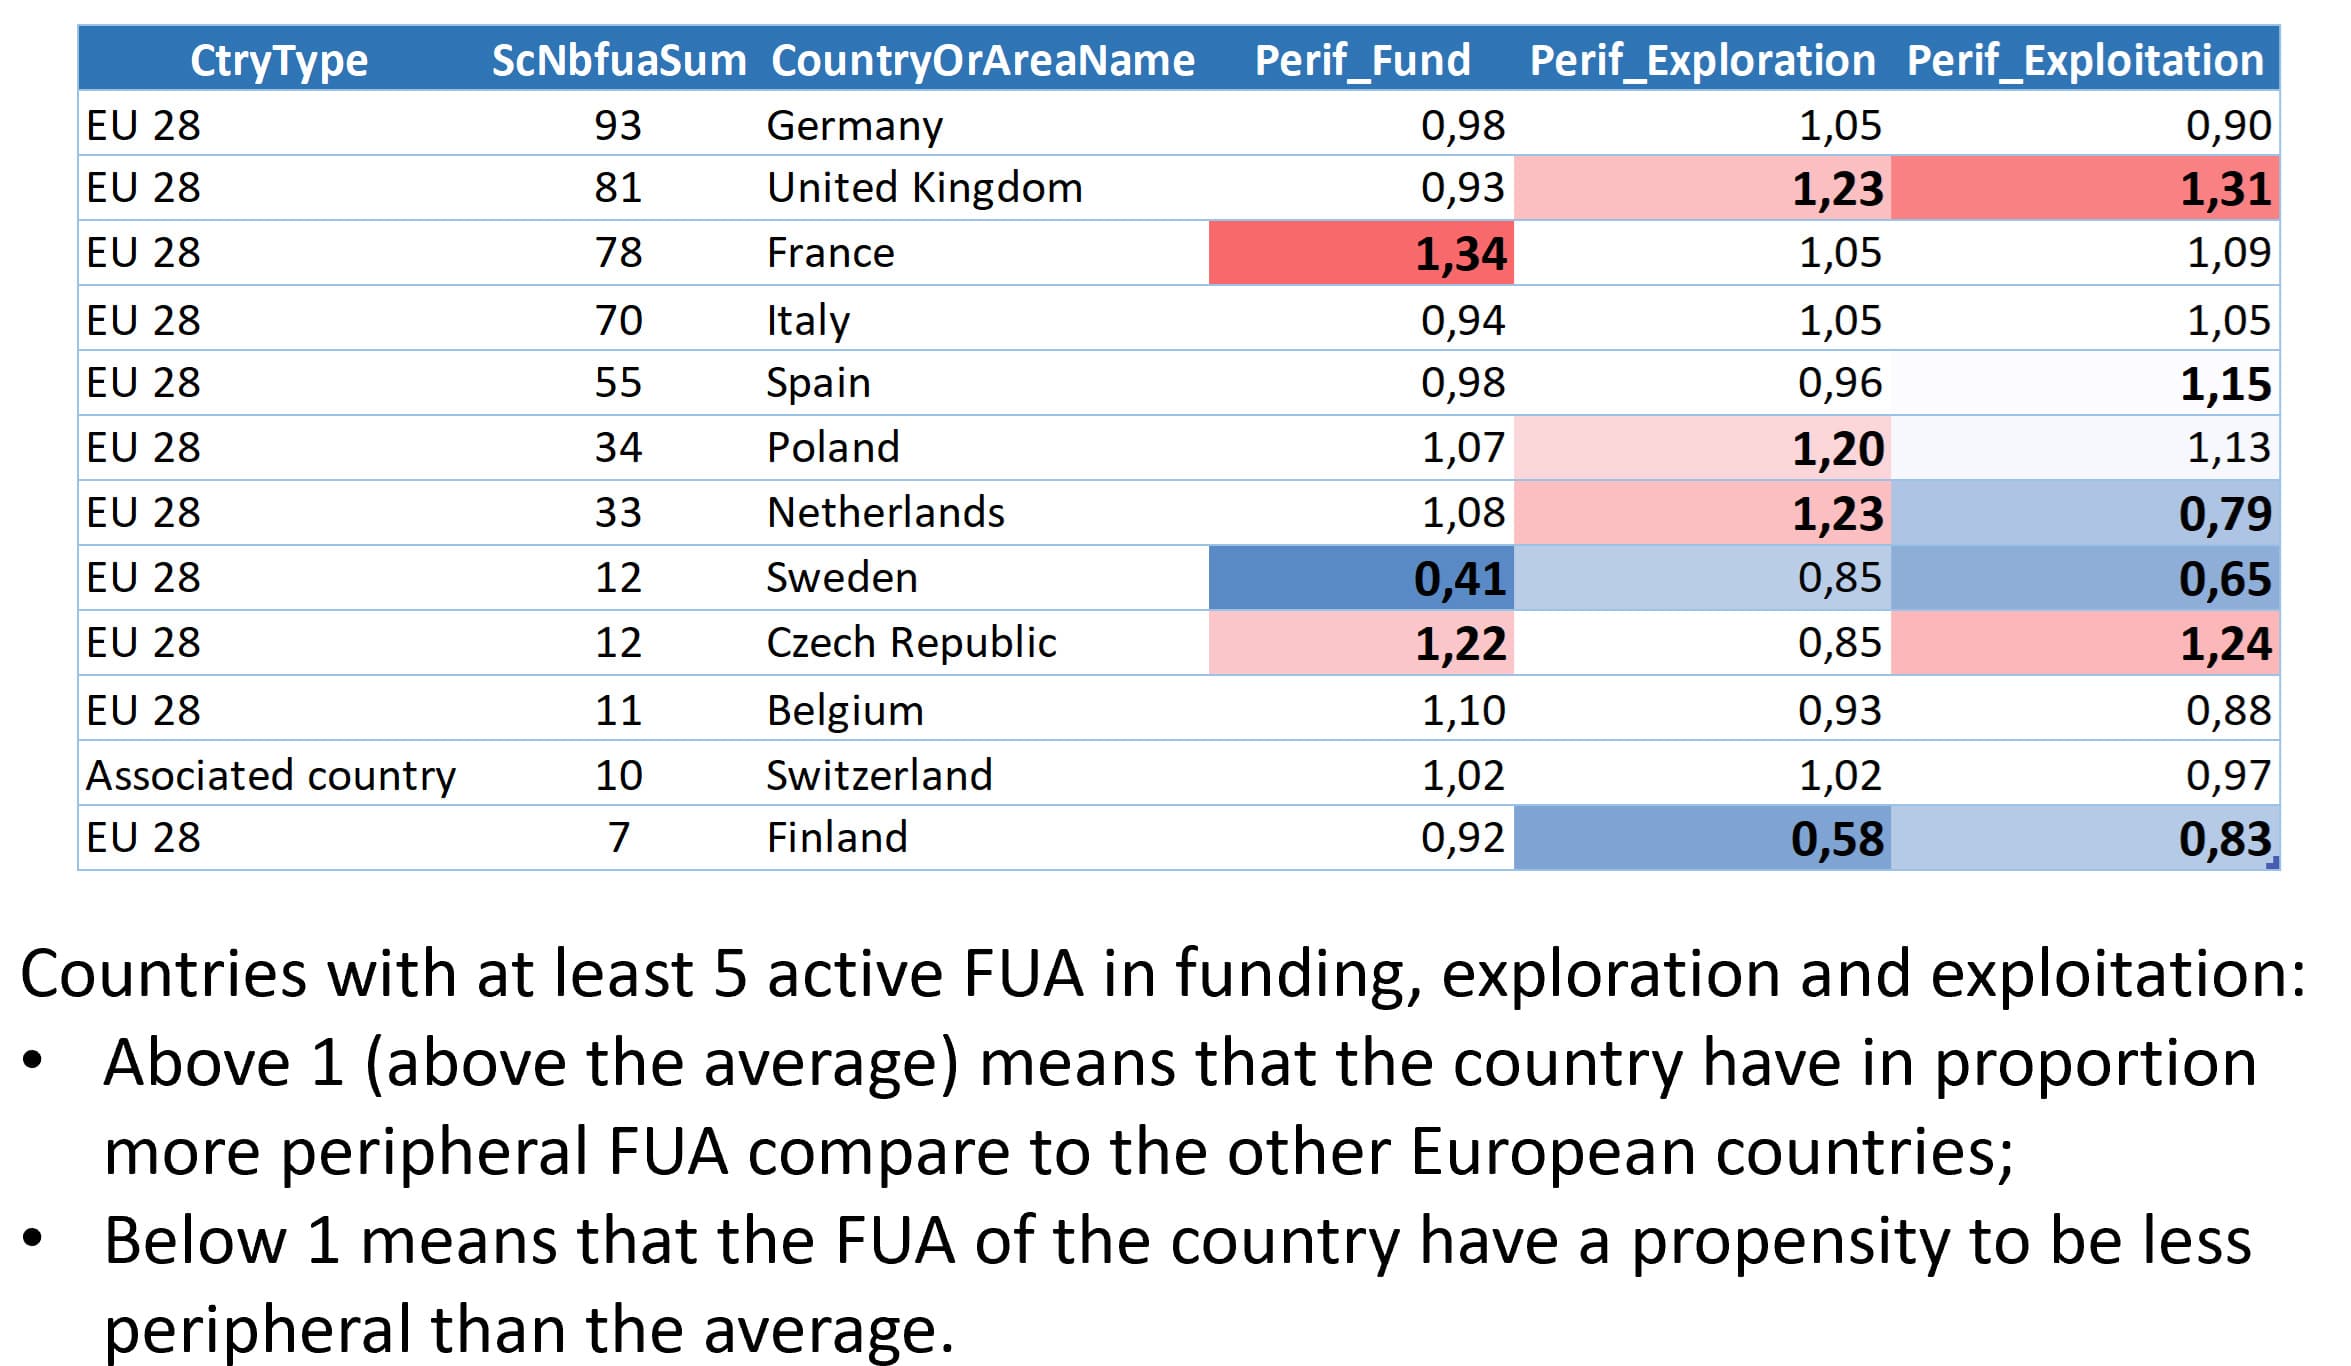
Proportion of peripheral FUA per countries
This work received technical and methodological support from RISIS, AIT and CorText, and benefited useful comments from Marc Barbier.